From the get-go, the Trump Administration – via DOGE – has been hell bent on causing destruction and havoc across the federal government. But why? There seems to be no cohesive narrative coming from the Trump administration regarding DOGE, the erosion of civil rights, attacks on immigrants, or the debt-exploding One Big Beautiful Bill Act (OBBB) that recently became law.
What is this historic chaos really about? If you’ve just arrived and are observing what’s happening in the United States, you might think that our most pressing issue is that the richest among us simply aren’t rich enough – as the Trump administration and the OBBB cuts public services and benefits that will make life more precarious for millions in the name of tax breaks for the rich.
While they play out their destructive tendencies predicated on non-existent problems like DEI or in service to imagined government waste, the real goal is to have a YOYO – you’re on your own – economic system for the masses in order to transfer more income to those without need.
One of the most striking statistics on inequality is the historical trend in the share of national income received by the Top 1 Percent. Figure 1 shows that at the end of the “Roaring Twenties,” just before the Great Depression, the Top 1 Percent held about 20 percent of all income (excluding capital gains) – about where it was in 2022 (most recent data available).

Importantly, the long trend in between is U-shaped – for the decades between the 1930s and the 1970s, inequality was falling or flat before starting to climb steeply beginning in the 1980s. The trough in inequality occurred in the early 1970s when the share of income controlled by the Top 1 Percent was just under 8 percent – which left more for the rest of us.
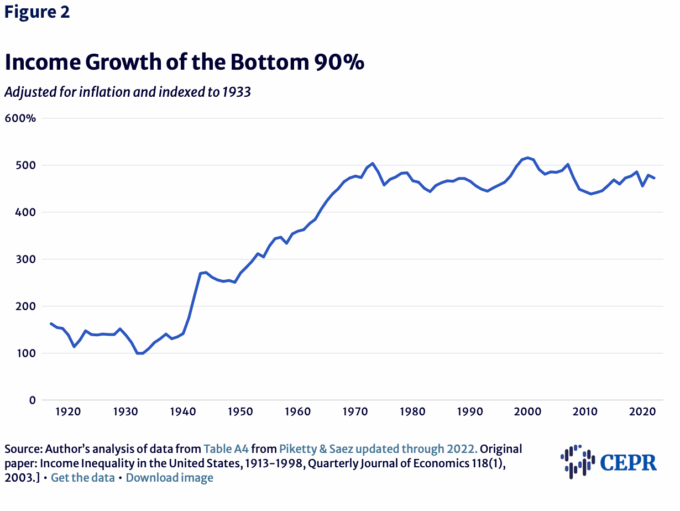
Over the period (1933-1973) when the Top 1 Percent held decreasing shares of national income, inflation-adjusted income grew fivefold for those in the Bottom 90 Percent – a historic increase depicted in Figure 2. The rich still got richer too, as the Top 1 Percent doubled their income over the same timeframe.
From 1973 through 2022, the share of national income held by the Top 1 Percent grew from just under 8 percent to nearly 20 percent. By the end of that period, the Top 1 Percent had seen a 222 percent increase in income, while those in the Bottom 90 Percent suffered a 6 percent decrease. Even more telling is that the income for the Top 0.01 Percent increased 850 percent over the same period!
The jumpy but mostly flat post-1973 trend in income growth for the Bottom 90 Percent shown in Figure 2 occurred even as the economy grew by 255 percent and worker productivity increased by 82 percent – indicating that the additional benefits of a growing economy along with increased efficiency elude most of the workers who produce it as it accrues to those at the top.
What brought about this U-shaped trend in inequality? The distribution of national income is not an accident. It is significantly dictated by purposeful policies – like those in the One Big Beautiful Bill, which will accomplish exactly what it set out to do.
It was an impressive array of post-Great Depression and WWII policies that enabled Americans to prosper, and a growing middle class to emerge. Policies such as the Glass-Steagall Banking Reform Act (1933), the Unemployment Insurance Program and Social Security Act (1935), the Fair Labor Standards Act and the first minimum wage (1938), Eisenhower’s 91 percent top marginal tax rate (1951), and the Medicare and Medicaid Act (1965) to name just a few.
But the unwinding of the roaring-1920s level of inequality ceased and reversed course by the early-1980s. The U-turn was led by President Reagan’s supply-side economic policies that favored unfettered markets, deregulation, attacks on unions, and defunding of the public sector. The top marginal income tax rate was lowered from 70 percent in 1980 to 28 percent in 1988, banks were deregulated and most of Glass-Steagall was repealed by 1999. And, of course, President Reagan broke the air traffic controllers strike in 1981. Then came NAFTA, more tax cuts, and Citizens United, to name a few policies that keep the upward trend going today.
These and many other policies influenced the historical divvying up of national income. Recent pandemic policies provide a stark example. At the beginning of the pandemic, in the face of a national emergency for families, the child tax credit was expanded along with other economic policies that quickly cut the supplemental poverty rate (which includes government payments and transfers) of children from a pre-pandemic 12.6 percent in 2019 to 5.2 percent in 2021 – an unprecedented decline. But the rate shot back to 12.4 percent in 2022 after the temporary policies phased out. In a country as wealthy as the United States we could choose to eradicate childhood poverty, but we don’t.
Far too many Americans wake up every day on the wrong side of our chosen capitalist system that circumvents our democracy and our ability to wholly thrive as a nation. We can’t have things needed, or nice – even with majority consensus – when the richest amongst us perpetually control ever more of our nation’s income, wealth and political power.
A country awash in resources and wealth, such as ours, should expand and implement new policies that enhance the greater good for the vast majority of us; policies that ensure broadly-based prosperity that begin again to lessen our obscene levels of inequality. The goal of the plutocrats, it seems, is to remove whatever daylight exists between their desires and a government of the people, by the people, for the people. The result may be the undoing of the great American middle class.
Importantly, the long trend in between is U-shaped – for the decades between the 1930s and the 1970s, inequality was falling or flat before starting to climb steeply beginning in the 1980s. The trough in inequality occurred in the early 1970s when the share of income controlled by the Top 1 Percent was just under 8 percent – which left more for the rest of us.
Over the period (1933-1973) when the Top 1 Percent held decreasing shares of national income, inflation-adjusted income grew fivefold for those in the Bottom 90 Percent – a historic increase depicted in Figure 2. The rich still got richer too, as the Top 1 Percent doubled their income over the same timeframe.
From 1973 through 2022, the share of national income held by the Top 1 Percent grew from just under 8 percent to nearly 20 percent. By the end of that period, the Top 1 Percent had seen a 222 percent increase in income, while those in the Bottom 90 Percent suffered a 6 percent decrease. Even more telling is that the income for the Top 0.01 Percent increased 850 percent over the same period!
The jumpy but mostly flat post-1973 trend in income growth for the Bottom 90 Percent shown in Figure 2 occurred even as the economy grew by 255 percent and worker productivity increased by 82 percent – indicating that the additional benefits of a growing economy along with increased efficiency elude most of the workers who produce it as it accrues to those at the top.
What brought about this U-shaped trend in inequality? The distribution of national income is not an accident. It is significantly dictated by purposeful policies – like those in the One Big Beautiful Bill, which will accomplish exactly what it set out to do.
It was an impressive array of post-Great Depression and WWII policies that enabled Americans to prosper, and a growing middle class to emerge. Policies such as the Glass-Steagall Banking Reform Act (1933), the Unemployment Insurance Program and Social Security Act (1935), the Fair Labor Standards Act and the first minimum wage (1938), Eisenhower’s 91 percent top marginal tax rate (1951), and the Medicare and Medicaid Act (1965) to name just a few.
But the unwinding of the roaring-1920s level of inequality ceased and reversed course by the early-1980s. The U-turn was led by President Reagan’s supply-side economic policies that favored unfettered markets, deregulation, attacks on unions, and defunding of the public sector. The top marginal income tax rate was lowered from 70 percent in 1980 to 28 percent in 1988, banks were deregulated and most of Glass-Steagall was repealed by 1999. And, of course, President Reagan broke the air traffic controllers strike in 1981. Then came NAFTA, more tax cuts, and Citizens United, to name a few policies that keep the upward trend going today.
These and many other policies influenced the historical divvying up of national income. Recent pandemic policies provide a stark example. At the beginning of the pandemic, in the face of a national emergency for families, the child tax credit was expanded along with other economic policies that quickly cut the supplemental poverty rate (which includes government payments and transfers) of children from a pre-pandemic 12.6 percent in 2019 to 5.2 percent in 2021 – an unprecedented decline. But the rate shot back to 12.4 percent in 2022 after the temporary policies phased out. In a country as wealthy as the United States we could choose to eradicate childhood poverty, but we don’t.
Far too many Americans wake up every day on the wrong side of our chosen capitalist system that circumvents our democracy and our ability to wholly thrive as a nation. We can’t have things needed, or nice – even with majority consensus – when the richest amongst us perpetually control ever more of our nation’s income, wealth and political power.
A country awash in resources and wealth, such as ours, should expand and implement new policies that enhance the greater good for the vast majority of us; policies that ensure broadly-based prosperity that begin again to lessen our obscene levels of inequality. The goal of the plutocrats, it seems, is to remove whatever daylight exists between their desires and a government of the people, by the people, for the people. The result may be the undoing of the great American middle class.
This first appeared on CEPR.
The post The Rich Are Not Rich Enough in America appeared first on CounterPunch.org.
This post was originally published on CounterPunch.org.