Yes, the dogs are barking that the latest CPI figures will deliver an interest rate cut this month after the election. Michael Pascoe is wondering about the dogs that didn’t bark earlier within the RBA.
The Australian Bureau of Statistics has shouted that the Reserve Bank of Australia was wrong not to trim interest rates at its April 1 meeting.
The funny thing is, the RBA itself back in February forecast that ABS verdict.
The dogs are barking that rates will be trimmed on May 20, a couple of weeks after the election. The mystery for me is why the dogs didn’t bark within the RBA much earlier.
The most impressive figure to come out of Wednesday’s ABS figures hasn’t been highlighted but it was quickly spotted by independent economist James Foster:
“In 6-month annualised terms, core inflation is sitting right on the midpoint of the RBA’s target band at 2.5%.”
As anyone other than the RBA board members can see, six-month annualisation of the trimmed mean has unsurprisingly proven to be a very nice guide to where the full year number is going.
A couple of major points about this:
Backward looking
Firstly, the RBA claims to be “forward looking”, as it should be given the lag with which monetary policy works. It also claims to be “data driven”. On the evidence of the data, I call bullshit.
Putting aside the way the bank has ignored its actual mandated target of the CPI, only caring about the trimmed mean measure, you’re not forward looking when you have inflation hitting the very exact target with monetary policy still restrictive, still tightening. It means you’re backward looking.
RBA “data driven” que?
As for being “data driven”, the bank has been ignoring the data. The best guide to what has been happening with inflation has been the monthly CPI numbers which have shown since September that the trimmed mean was within the two-to-three per cent range with the trend heading in the right direction.
Secondly, and this is the strangest bit, the RBA itself back in the February statement on monetary policy effectively forecast that the six month annualised trimmed mean would be 2.5 per cent now.
So the bank ignored the data and its own forecast in considering interest rates on April 1.
The conspiracy
I’ve been wary of giving any credence to suggestions of a political dimension to the RBA’s decision making, the idea of the bank not wanting to be seen to be giving Labor a hand by cutting rates at the meeting before an election. Back on April 1, Labor was not being tipped to win the election.
Could an institution that had been battered by Jim Chalmers’ dubious review be more than a little gun shy, be wary of doing anything that might put it offside with a new government, would prefer to play it safe by sitting on its hands until the next meeting, even if only subconsciously? After all, waiting for the next meeting is neither here nor there for the RBA board.
It’s not impossible, though I prefer to think it’s more a matter of the bank being timid. To use a phrase I think I might have coined, it’s a matter of the bank lacking the courage of having convictions.
Trumpmania syndrome
On top of its own February forecasts and fresh data, the bank’s last meeting also had forecasts from the world’s major economic bodies that Trumpmania was going to weaken the Australian and global economies. That’s the sort of thing that should have increased the call for a rate trimming, to actually look ahead rather than behind.
But, no, the RBA dogs didn’t bark. A mystery.
As posited here in February, if the election was to be a close-run thing, it would be rich if Chalmers’ RBA review was to cost Labor government, given how that review was obviously deficient on several fronts but enthusiastically adopted in full with undue haste. (https://michaelwest.com.au/pascoe-how-the-rba-got-it-wrong-on-interest-rates/ )
The economy in general and the cost of living in particular have been two of the main themes of the election campaign, with both major parties claiming to be the better managers. Alan Austin reports on what the IMF and the ABS have to say.
The latest half-yearly report from the International Monetary Fund (IMF) shows Australia climbing most global rankings, reversing the slide under the Coalition.
The IMF allows global comparisons by showing outcomes for 117 countries from 2016 to 2024 on twenty indicators. These include budget deficits/surpluses, tax revenue, government spending, national debt and net financial worth. It also shows projections through to 2030, although those were made before Trump’s tariff wars. So we shall see.
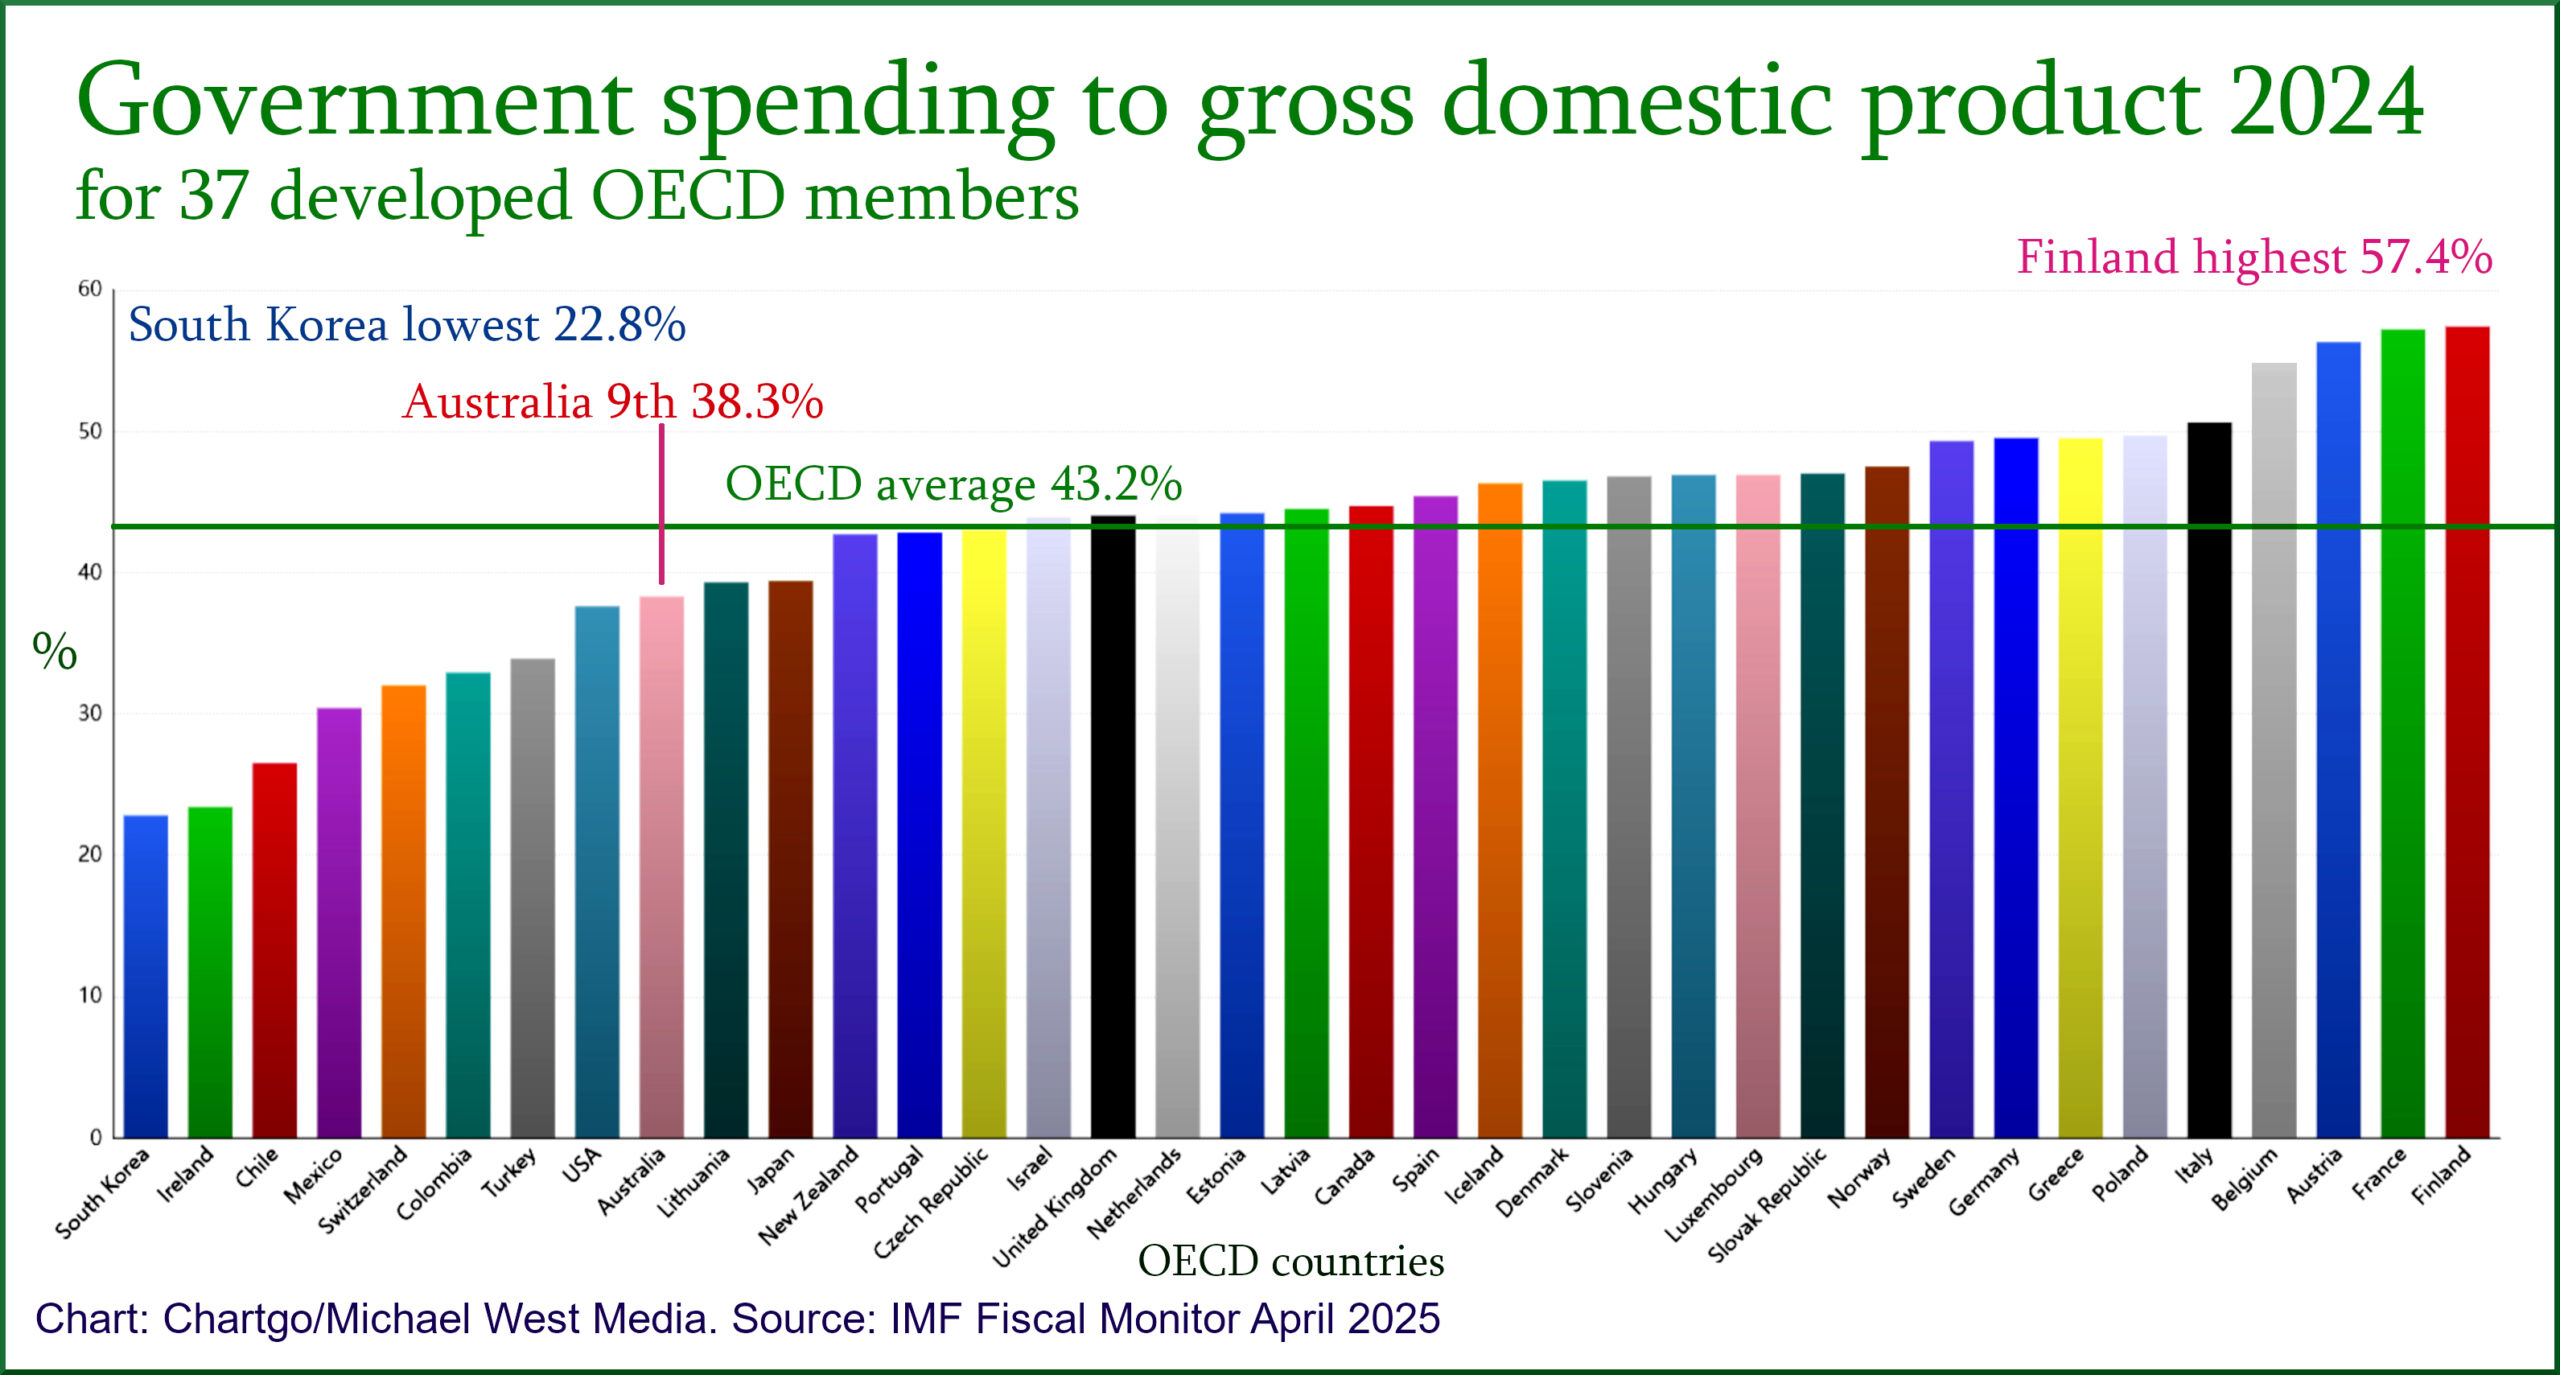
The tables on government revenue and expenditure confirm Australia is a relatively low-taxing and low-spending nation.
Australia ranked tenth on taxes collected relative to gross domestic product (GDP) among 37 wealthy OECD countries in both 2023 and 2024. That’s up from 11th or 12th between 2016 and 2019, pre-Covid, under the Coalition.
Australia ranked ninth out of 37 on government spending in 2024, up from 12th or 13th between 2016 and 2019. Government expenditure at 38.3% of GDP is well below the OECD average of 43.2%, and a far cry from the nine successful European economies spending more than 49.0%.
Debt declining
The IMF shows Australia’s net debt was just 30.1% of GDP in 2024, down 5.5% from the 2021 peak of 35.6% – in just three years.
Fewer than half the OECD reduced their net debt in that period – which was nowhere near as easy as the years 2014 to 2019 when all well-managed economies generated strong surpluses and repaid the debt stacked on in the global financial crisis.
The general picture the IMF paints is as positive for Australia as for any nation, along with Switzerland, Norway and Denmark. (Publisher’s note: Go Norway!)
This month’s pre-election economic and fiscal outlook (PEFO), prepared by the politically neutral secretaries of Treasury and the Finance Department, is highly instructive, especially when contrasted with the 2022 PEFO.
Deficits for the four years 2023 to 2026 were forecast before the last election to be $224.4 billion. After Labor changed Coalition budget settings, those deficits reduced to $31.9 billion, aided also by a strong global economy and higher tax income due to high commodity prices.
The department heads in 2022 forecast gross debt to reach $1,000 billion under Coalition policies in 2023-24. After the change of government, that did not happen. Debt is now forecast to hit the trillion some time in 2025-26, which may not happen either, depending on commodity prices and global conditions.
The boffins forecast gross debt at June 2026 would be $1,169.0 billion under the Coalition. They now predict $1,022.0 billion under Labor – $147 billion lower.
The Coalition’s interest payable on the debt for the three years 2024 to 2026 was to have been $57.3 billion. Labor has cut this to $45.7 billion.
Bureau bursts Coalition bubble
Several recent announcements from the Bureau of Statistics (ABS) undermine Opposition claims that most citizens are worse off now than in 2022.
The ABS has confirmed that the majority nay be better off with these reports:
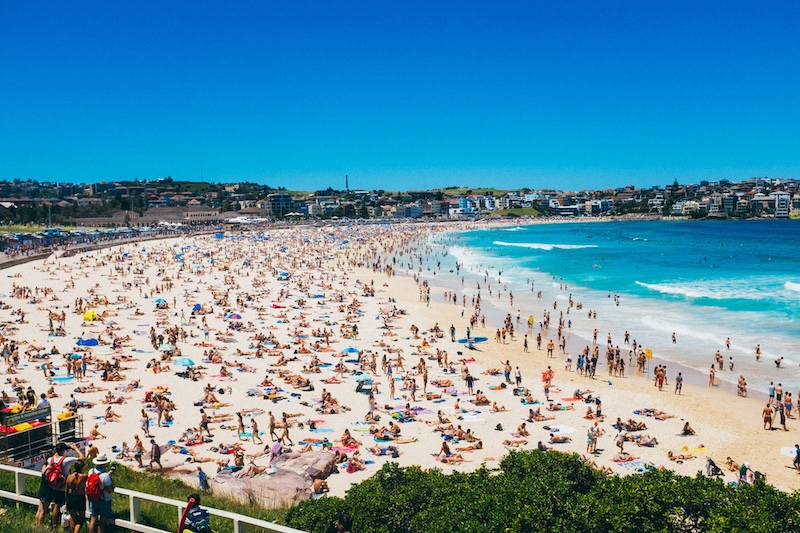
Item #1. Employees in food and accommodation services have hit new records, confirming Australians are dining out and holidaying more frequently.
Item #2. Jobs in other areas of discretionary spending – arts and recreation, luxury retail sales – are also surging, in numbers and as a percentage of all jobs.
Item #3. Australian residents took 923,360 overseas trips in February, an all-time high for any February. Flights during the three months of December to February tallied a record 3,291,250, up 13.2% on the previous year.
Item #4. Total household spending in February reached a fresh all-time high of $75.6 billion. That’s five consecutive record months.
Item #5. Jobs outcomes for March, as reported last Thursday, continue to be close to the best-ever. The unemployment rate of 4.05% extends the streak of months below 4.25% to 40.
Item #6. Jobless Australians have been fewer than 650,000 for 40 months, another impressive milestone. Under the previous government, this exceeded 900,000 seven times, clicking over one million in July 2020, during the pandemic.
Item #7. The fortnightly age pension is up 12.2% since December 2022, when Labor’s first budget took effect, to $1,051.30; the adult unemployment benefit has risen 16.9% to $781.10; the living away from home youth allowance is 25.1% higher at $663.30.
Item #8. Wage rises have been above inflation for the last 16 months.
Many groups, including inner-city renters, may find all of the above irrelevant as they continue to feel the pinch of ever-increasing rents as housing supply remains well behind demand. But that’s another story.
It’s complicated. Nevertheless, may the best economic management team win on Saturday.
This post was originally published on Michael West.
Poor old Donald Trump thinks the United States still dominates the global economy, but the ‘stable genius’ has lost touch with reality and is a couple of decades out of date, writes Michael Pascoe.
The US is important, the traditional consumer of last resort, but relatively speaking, it is no longer the colossus it once was. Other than in the fantasies of Emperor No Clothes, the US can no longer use economic heft to command the world.
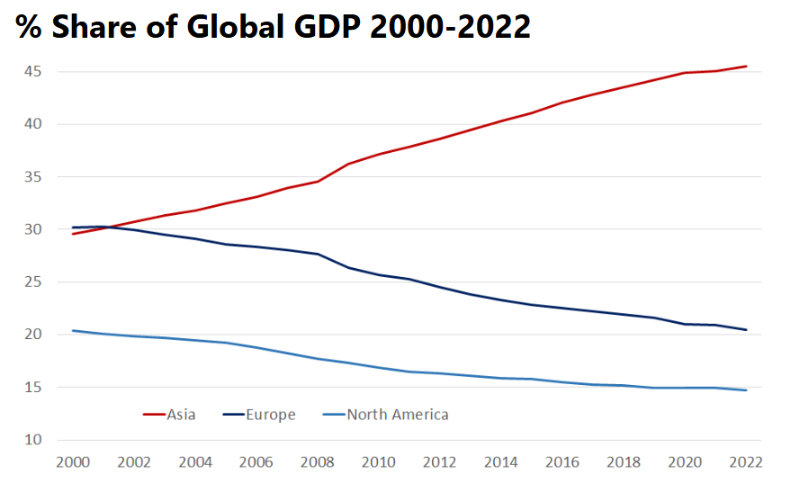
You can quibble about what set of statistics you want to use and nominal versus purchasing power parity measures, but the reality eluding the Trump gang is in this World Economics graph.
Source: www.worldeconomics.com
It’s a mistake to concentrate too much on the “Chinah” part of Trump’s war on global trade. China, being America’s prime target, distracts from the totality of the mismatch Trump has chosen. (And it’s a bigger mistake to think China is most affected by the war, I’ll come to that.)
Long before Peter Navarro became Trump’s tariff capo bastone, he was a rabid Sinophobe, best known for his 2006 book, The Coming China Wars, and his 2011 tome, Death by China, subsequently turned into a quasi-documentary. A taste of the book is that it quotes a fictitious Harvard economics student, Ron Vara, (an anagram, geddit): “The Manufacturing Dragon is voracious. The Colonial Dragon is relentless. The American Eagle is asleep at the wheel.”
As for the “documentary”, Wikileaks offers the New York Times review observation that the “alarming and alarmist” film “undercuts its argument with an abundance of inflammatory language and cheesy graphics” and “is also unabashedly one-sided and short on solutions” but “its message, despite the hyperbole, certainly warrants examination and discussion”.
The LA Times found the “important political argument…was drowned out by xenophobic hysteria and exaggerations so rampant it becomes impossible to tell light from heat”.
In other words, it was exactly Trump’s kind of show, receiving a glowing endorsement, and 75-year-old Navarro is very much Trump’s kind of capo with a track record of promoting hydroxychloroquine as a COVID treatment, spreading conspiracy theories of election fraud and becoming the first former White House official to be jailed on contempt of Congress charges. Such is the quality of the man calling Trump’s tariff shots.
“Death by China”
Whatever Death by China’s merits or otherwise, America has missed its chance to put China back in its box and keep it there, if it ever had such a chance once China decided to open up. The International Monetary Fund scores China’s share of the global economy at 19.3% on purchasing power parity (PPP) basis and the US at 15.6%.
World Economics research reckons the US share is 12.7% with China at 19.6 GDP and projected to rise to 22.1% in 2030.
(At current prices, the IMF counts America’s GDP as worth US$30.34 trillion and China’s as US$19.53 trillion, but PPP is generally considered a better basis for comparison.)
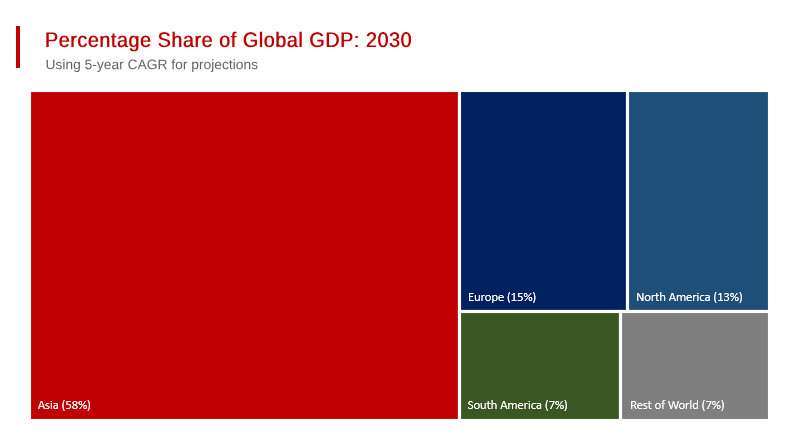
In any case, China is only part of the Asia story. World Economics’ 2030 projection will no doubt be changed by the Navarro/Trump tariffarama. I’d bet it will make the US share smaller than the forecast 13%, and Asia’s 58% will be larger.
Source: www.worldeconomics.com
America’s desire to bifurcate the world, putting China behind a tariff curtain and forcing other nations to choose “US or them” fails when the US is no longer the undisputed global economic superpower, let alone when it behaves like the proverbial pigeon playing chess – knocking over the pieces and shitting on the board.
Trump boasts of foreign leaders “kissing his arse” to get a tariff discount. What he ignores is the contempt he is held in and the destruction of any faith in America’s reliability. Insults and loss of face don’t go down well anywhere, but least of all in Asia.
The South China Morning Postcompiled a list of how dependent six major Asian economies are on the US market, dividing their GDP by their exports to the US. As the paper teased, China’s place on the list “could be surprising”.
Liberation Day stunt
On top of stopping USAID efforts to clean up Agent Orange and unexploded American munitions and landmines, Trump’s “Liberation Day” stunt included a 46% tariff hike on Vietnam, whose exports to the US are equal to 23% of its GDP.
The US is Vietnam’s biggest customer, accounting for nearly 30% of exports, followed by China at around 20%. Whatever goodwill the US might have been cultivating with Vietnam is gone.
Thailand was promised a 36% tariff. Its exports to the US equal 9.3% of its GDP. Malaysia’s US exports equal 8.9% of GDP. Have a 24% tariff. South Korea exports worth 6.2% of GDP, take a 25% “reciprocal tariff” threat.
Japan, a 24% tariff for 3.4% of GDP.
China’s exports to the US are now being threatened with, well, pick a number, any number, 145% last time I looked,
but those exports are the equivalent of “only” 2.7% of China’s GDP.
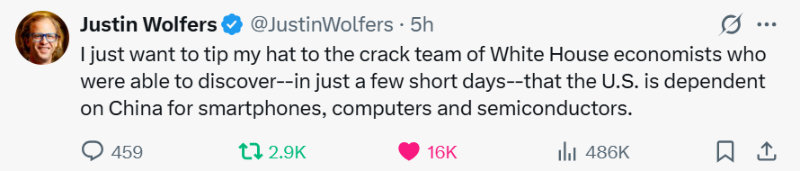
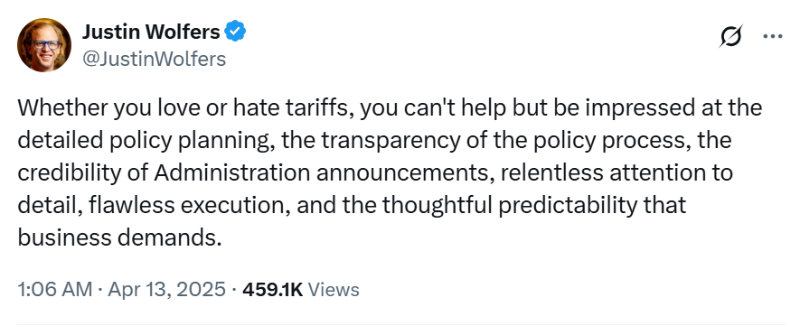
To lose it all would obviously hurt, though the Trump clowns have already realised that, d’oh, China makes stuff America needs. As American-resident Australian economist Justin Wolfers tweeted:
Professor Wolfers seems to have forgotten very few Americans speak irony.
China is prepared
China has been preparing for this trade war, its export markets diversified, America’s intentions well telegraphed. China has the advantage of high savings and an under-utilised domestic consumer market ready for priming if required.
At the same time, the US sinks further trillions into debt after decades of living beyond its means, something the bond market last week signalled may not be sustainable after all if fools run the place.
And China has the benefit of Donald Trump making it look more reliable and pragmatic and certainly less insulting than the US. Trump is providing China with an incredible opportunity to straighten up, fly right and win while the US loses.
Which is why Australia would be particularly stupid to fall in with Trump’s bifurcation plans, as Crikey’s Bernard Keane reasonably believes ($) the weak ALP/LNP leadership will.
How dumb would you have to be to pick this particular moment of historic turmoil to act all Trumpy and seize the Darwin port lease? The answer is as dumb as the ALP and LNP leadership.
Unreservedly sticking with AUKUS and what we pretend is the US alliance, signalling that we’re all the way with the USA even when the USA has gone crazy and worse, just means we’re picking the losing side instead of prioritising our own interests.
Donald Trump has declared a trade war, the share market is down, and US t-bond yields are rising. But how did it all start, and what’s next? Michael West and Kim Wingerei with the lowdown.
They say that truth is stranger than fiction, and when it comes to what Trump and his acolytes are doing to world markets, they are not wrong! Donald tanked the economy based on a book his son-in-law found on Amazon.
Donald Trump told Jared Kushner to find him an economic advisor – someone who could make him “look tough” and talk tough on China. Jared searched Amazon, saw a book called Death by China, and thought the title was “cool.” So he cold-called the author, Peter Navarro, and gave him a job.
It turns out that Navarro has no real economic credentials, except for an obsession with tariffs and a made-up expert named “Ron Vara” whom he cited repeatedly in his books. Who’s Ron Vara? A fictional economist, Navarro invented. It’s an anagram of his name.
This is not a joke. This is literally how the Trump administration created its trade policy – one that has so far wiped out $10 trillion in wealth, crashed markets, and has put the world at the brink of recession. A fake expert. A book cover. An Amazon search!
The China (bond) Syndrome
Earlier this year, the US imposed a 20% tariff on Chinese imports. On ‘Liberation Day‘, Trump added another 34%, and overnight, he vowed to up the ante and slap China with a 104% tariff on goods imported to the US.
The stakes are rising. China has yet to respond to the latest hike, but President Xi Jinping has made it clear he’s up for a “fight to the end”. According to The Economist, that may mean a “decoupling between the world’s two largest economies.” The cost of that on both sides of the Pacific is hard to measure.
China does, however, have another option: the ‘nuclear’ option of selling US treasury bonds, which would drive yields up and prices down and send the world into recession.
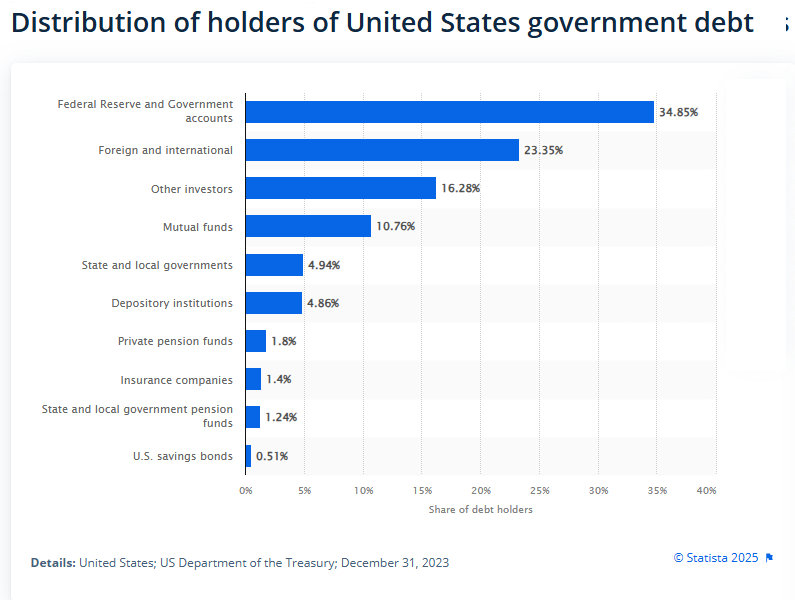
US Treasuries, or the US bond market, is the biggest market in the world, worth about $50 trillion, or around half of the world’s bond debt. Treasury bonds is how the US finances its deficit. Issuing bonds means borrowing money. But from whom? Who buys this stuff? Who owns most of the US Bonds?
Apart from the Federal Reserve and the US Government itself, the largest holders of US Treasury Bonds are Japan with US$1.1 trillion and China with US$868 billion (as of November 2024, Investopedia.).
China and Japan have had massive trade surpluses over the years, so what have they done with the money? A lot of it has been pumped into bonds, which are safe havens.
But it is no longer safe. This is the bit to understand. Bond prices are the inverse of yields, so when you sell a lot of bonds, you drive the price down. If the price goes down, the yield, or the interest rate, goes up. That’s what’s been happening this week.
And who knows if the Chinese are selling in quantity already? US 10-year bond yields are up by 10% since Liberation Day. It’s a heck of a lever to pull.
Tariffs are just a tax, so Donald is slamming massive taxes on imports.
That means prices for imports are going up, possibly at the same time there is upward pressure on interest rates because of people fleeing for the hills in the bond market. The knuckleheads in the US have hit their own voters the hardest.
But why would China want to flog its bonds, you ask? If they sell a whole lot, the price goes down for the rest they own, and they are simply hurting demand for their own goods in their biggest market, America. But Donald’s tariffs are doing that for them anyway. The just announced 104% simply doubles the price of everything from China.
Everything means all kinds of consumer goods, pharmaceutical ingredients, and electronics, including smartphones (9% of total). Hundreds of thousands of products with well-established supply chains are not easily replaced.
It is difficult to comprehend the scale of what is going on here, the sheer abomination which is US leadership in the world. Australia’s biggest export, iron ore, is tumbling, which means less money coming into our economy, which means less revenue for the Budget, which means fewer services for Australians.
Tariffs also mean less trade, which means lower economic activity worldwide. That is what is happening now, Trump’s aim is to boost US manufacturing to replace imports, but he is driving the world into recession.
Second, market turmoil means severe dislocation, like what happened during the GFC, so that will trigger further fallout.
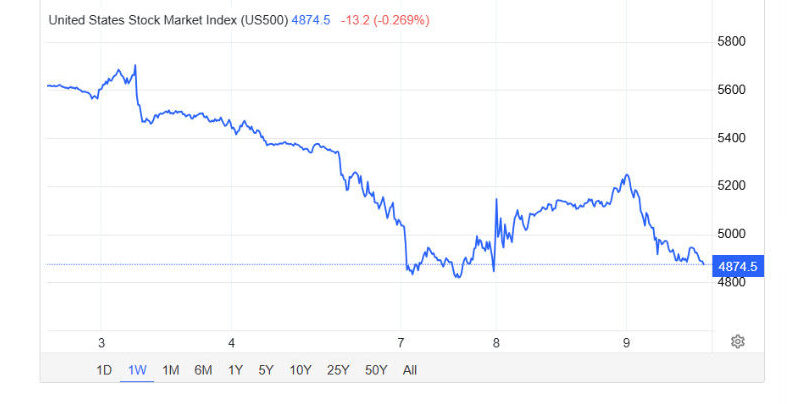
Along with the potential bond mayhem, there is a lot of stuff going on in the stock market, too: margin calls, short selling, funds in trouble, and forced sellers. What happens when share prices go down? The companies’ cost of capital rises.
US500 Index past week. Source: tradingeconomics.com
There is strong precedent for a tariff-driven disaster. When the US sharemarket crashed in 1929, the ‘Smoot-Hawley Act‘ hiked tariffs around the world, and trade dropped 20pc. A year or two later, we had the Great Depression, then hyperinflation in Germany, more debt defaults and the rise of Hitler, and World War II.
We are not saying this will happen again. As Mark Twain once said, “History never repeats itself, but it does often rhyme.” What we are saying is that it is impossible to predict what’s next, but in all likelihood it will get worse with one of the first effects being severe disruptions to world supply chains.
What about Australia?
Trump’s dopes claim they are trying to tackle trade deficits of the US, but they actually run a trade surplus with Australia, so the extra 10% imposed on Australian goods into the US makes no sense. Why don’t they buy Australian beef, they cry?
Because we are one of the biggest exporters of the stuff in the world. Do you want us to buy your iron ore and coal too?
How did Australia get locked into this giant stuff up, foreign policy completely rooted, allied to a bunch of dangerous morons engaged in genocide and destruction of the world economy. Time to get out of AUKUS, the greatest foreign policy hospital pass in history.
Housing affordability is a big issue for many Australians. Both the major parties claim to want to fix it, but neither has a plan to address the real causes of the crisis. Harry Chemay with the facts.
You know the housing market is in crisis when a high-flying investment banker and the CEO of an industry super fund make the same observations to the nation’s premier business publication.
Not natural allies by any stretch, one facilitates the pursuit of commercial profit-seeking, while the other represents some 3.5 million individuals hoping for a dignified retirement at some point in their lives.
Yet here they were, just days apart, with remarkably similar and profoundly disturbing insights into the woeful state of housing affordability in Australia today.
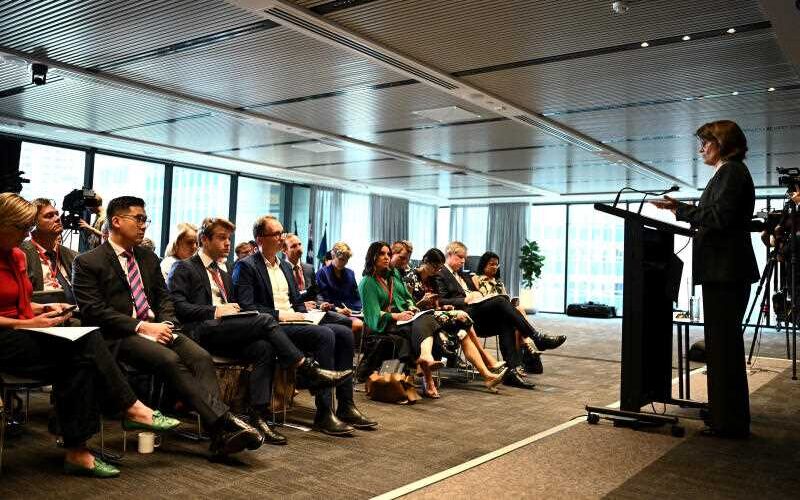
In early March, the CEO of Melbourne-based AustralianSuper, Paul Schroder, took to the stage at the AFR Business Summit and said this:
I think the big, burning productivity and cost of living problem is housing.
“I think we keep underestimating how worrying housing is. This is the crisis that is facing Australia.
“All we’ve done is pour all of this money into houses, which has deprived the economy of heaps and heaps of productive capital. We’ve got all this money in our domestic houses and we’re not backing business, we’re not creating new things, we’re not driving productivity.
“So, to me, all of our pants should be on fire about housing. Because, if our kids can’t live safely and securely, how can you be freed up to think positively about productivity or the future, if you don’t know where you’re going to live?”
About two weeks later, Jonathan Mott, a senior banking analyst at Sydney-based Barrenjoey Investment Bank, was on stage at the AFR Banking Summit and dropped more housing truth-bombs:
“Over the last three years, since we’ve started seeing rates go up, the lending to owner-occupier [households] who earn less than $120,000 per year (which is 60% of society) has fallen 66%. Only 8% of credit goes to owner-occupiers earning less than this.
At the same time, lending to investors earning more than $500,000 per annum is up 166%.
“This one percent of society is getting more credit [9% of mortgage lending] than the 60% who are owner-occupiers.
“This is not sustainable. If it doesn’t change and you live in Sydney, you’ll never know your grandkids, because they won’t be able to afford a house. They won’t live here.”
Both Schroder and Mott are experienced senior financial executives who can see today’s housing market for what it is: a brutal competition in which generally lower-to-middle income Australians are pitted against each other in a ‘housing hunger games’, either to rent from high-income investors or to buy from owner-occupiers (with the constant threat of being out-competed by better-funded investors).
Jonathan Mott’s concern about Sydney’s housing market has been validated by the just-released CoreLogic Home Value Index, which saw the median house price in the harbour city hit $1,472,393 during March, a new all-time high. Unit prices, meanwhile, rose to $851,934, 23% higher than the next most expensive capital city, Brisbane.
Mott is one of Australia’s most experienced banking analysts. He knows the role that mortgage lending plays in rocketing property prices, mortgage debt now sitting at some $3 trillion outstanding across homeowners and investors.
He would also undoubtedly be familiar with the current stats. The national average mortgage for a first-time home buyer is now around $520,000, while for existing owner-occupiers, it’s around $670,000 nationally and $811,000 in his home state of NSW.
Try servicing a 30-year $800,000 principal and interest mortgage at 6.25% pa on the median NSW household income of around $140,000. I make just under $5,000 per month on a household take-home pay of around $9,500.
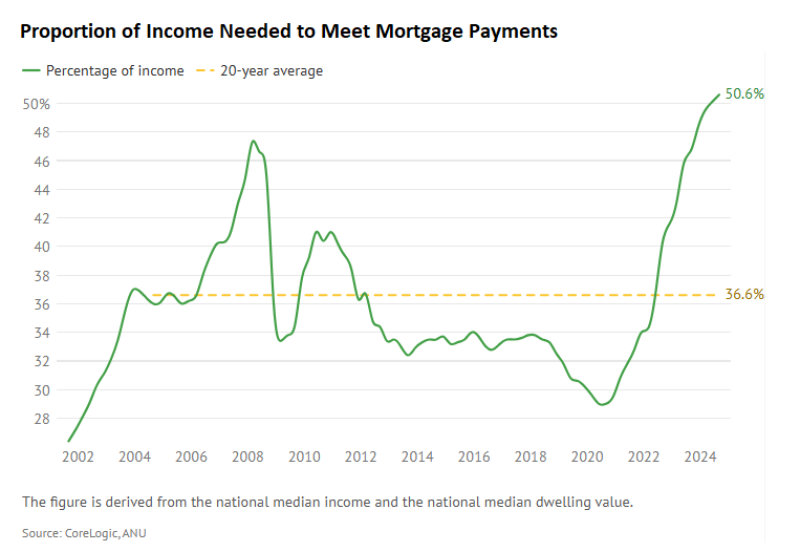
It’s little wonder that mortgaged households were caught out by the 2022-23 spike in official rates from 0.1% to 4.35% (before last month’s 0.25% cut). The proportion of household income needed to service a mortgage rose from under 30% in 2020 to now accounting for more than 50% of a typical mortgaged household’s budget.
That’s been a key cost-of-living drain for many of Australia’s roughly 3.7 million mortgaged households, who collectively owe around $1.5 trillion, particularly lower-income and younger borrowers.
If you engineer a system where homeowners are forced to take on ever-increasing levels of debt relative to their household incomes, they invariably face more interest rate risk. Alas, such is life in the mortgage nation that is Australia today.
Paul Schroder’s focus at the AFR Business Summit was on productivity, that magical economic quantity said to drive our living standards. Productivity is, in essence, the amount of output each employee generates on average for each hour spent working.
More output per hour results, all else equal, in higher total national income and, in theory, the ability for employers to pay their workers higher salaries without consumer inflation becoming a concern ($).
Productivity is one of the ‘Three P’s’ in Treasury’s long-term GDP forecasting, alongside population and labour participation levels. Except productivity has essentially flatlined since 2016 and has actually been going backwards more recently.
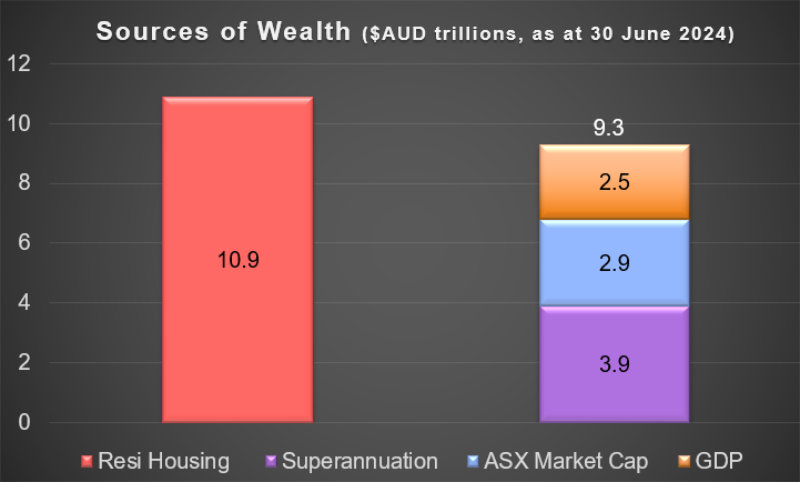
The AustralianSuper CEO identified a very likely contributor to the problem when he noted that our love affair with property sees Australia with a $11 trillion housing market and a $3 trillion GDP (almost 4X), versus a $50 trillion US housing market relative to its $29 trillion economy (about 1.7X).
Schroder’s argument that Australians over-save on residential property and deprive the productive economy of a domestic source of capital is valid. I made the same point in 2021 and again in a retirement conference last October to a room full of superannuation executives.
Source: ABS, APRA, ASX (author’s calculations)
You can take the entire Australian economy, add both the value of the ASX and the superannuation system,
and still be $1.6 trillion short of the wealth tied up in residential property.
That’s wealth currently held in non-productive land and buildings that could be used by Australian businesses to create Australian products and services, employ more Australians, and drive that elusive productivity lift.
Because even the Productivity Commission, in its recent deep dive into housing construction productivity, admitted that we get half as much house per construction hour worked than we did three decades ago. If productivity growth is indeed the path to economic prosperity for all Australians, then perhaps continuing to bank on residential property is not the long-term road there.
Trade tension impact
Something to think about in a post ‘Liberation Day’ world; a world where rising trade tensions will put the focus squarely back on productivity, and in finding ways to support Australian businesses to compete, grow, employ and generate rising incomes.
Being leveraged up to the eyeballs to own property might provide the illusion of wealth (the RBA itself accepts that a ‘wealth effect’ exists here), but it won’t do much to raise long-term living standards for working Australians.
And approaching retirement with mortgage debt, as one in two households aged between 55 and 64 now do, won’t help living standards thereafter either. That’s the legacy of real mortgage debt for those over 55 increasing by more than 600% between 1987 and 2015.
It’s a game of property snakes and ladders that Australia has played over the last 25 years. A game that, as Mott correctly asserts, is patently unsustainable.
As crazy as Trump’s tariff mania is, the world will keep turning with not as much damage as the headlines have us believe, Michael Pascoe writes.
Recession in America, global growth reduced by a third, China shrunk, Australia whacked, the earth splitting asunder spewing forth serpents…or maybe not.
Nobody needs further proof that the inmates are running the Washington asylum, a.k.a. the White House, but yes, add to the pile the Trump gang’s view that Europe’s VAT and Australia’s GST are protectionist levies. On the other hand, keeping the VAT/GST in mind helps lower the fever around “Liberation Day” headlines.
It’s a given that tariffs primarily work as a tax on consumption. America doesn’t have a federal consumption tax, just a patchwork of state and local sales taxes ranging from zero to 10.1 per cent.
Try looking at Trump’s new blanket base tariff of 10% as a partial federal consumption tax, and it is not quite so scary. Even with the “reciprocal” tariffs, averaging about 15% by Goldman Sachs’ estimate, they only cover a minority of Americans’ consumption.
Cars, steel, aluminium, and some other goods yet to be specified are different, but overall, tariffarama should have less immediate US consumer impact than the introduction of Australia’s GST did. At that time, our central bank agreed to “look through” the one-off hit to inflation, as the Federal Reserve might be tempted to, given the likely concurrent impact of weakening consumption.
Make no mistake, Trump and friends are idiots, while those who voted for him and continue to support him are worse. Cue the Sky After Dark gang. Just as Trump falsely promised to lower the price of eggs, he has claimed the tariffs will lead to lower prices for Americans. Not on this planet.
The tariff crusade is and will damage America, making it less, not great again.
(An anonymous White House official also has been quoted as saying quality wasn’t the reason Americans bought more European cars than Europeans bought American cars. Tell him he’s dreamin’, too.)
In very rough numbers, the US imported US$3.3 trillion worth of stuff in 2024, some of which is re-exported. And Trump doesn’t seem to have thought of services yet, perhaps because the US runs a services trade surplus, perhaps because he doesn’t think. US retail sales were 58% more than that – US$5.28 trillion.
Unintended consequences?
And then there is the reality of exchange rate movements and exporters and American importers shaving margins a bit to stay competitive. Goldman Sachs is guessing the tariffs, including the 25% on auto parts and vehicles, will add 0.5% to America’s “core personal consumption expenditures”, an inflation measure.
If the Fed thought the tariff thing would stabilise – a big “if” – the central bank could stay relatively calm and not try to damage the US economy any more than Trump is. Of course, the bald numbers only tell part of the story. A couple of percentage points less than a fifth of Americans’ food is imported, so divide the tariff impact by five, and it doesn’t look so bad.
But nearly 60% of America’s fresh fruit and nuts are imported along with 40% of vegetables. Obviously not a problem if your diet is based on McDonald’s, though the 45 grams of Australian meat in a cheeseburger might cost 30 cents more.
The US can no more re-industrialise overnight than Elon Musk can live on Mars. US industrial capacity is only running a percentage point or so below its long-run average.
There are not vast arrays of American factories ready or wanting to fill the country’s $2 shops.
US consumers will have to keep buying imported food as US farmers already produce about as much as they can produce, never mind what happens if their illegal crop pickers are deported.
The international beef market is deep. America exports nearly four times as much beef as it imports from Australia. Its main markets are, in order, Japan, South Korea, Mexico, Canada and China. They are all countries looking for retaliation that is relatively painless for their own consumers. Ditching US beef fits that bill.
Which means there might be more tasteless American grain-fed beef available for McDonald’s patties if our superior free-range beef is priced out of the market, but I doubt it. American cattle farmers are not efficient enough.
Trump’s latest trade war is old news for China. It is already exporting more to the global “South” than it is to all of the “West”. China knows its economic future does not lie in selling MAGA hats to daft Americans.
As a Bloomberg writer summarised it:
“Trump’s escalating tariffs are expected to raise the cost of trillions of dollars in goods shipped annually to the US from other countries, with most economists predicting American consumers will be among the hardest hit as a result. Trump’s latest salvo also turbocharges the worldwide trade war he began, a conflict likely to be marked by tit-for-tat strikes that destabilize supply chains, stoke inflation and encourage more countries to form alliances that exclude America.
“That dynamic presents a political problem for Trump, as his strategy may halt US economic growth in its tracks. And even if he’s eventually proven correct that his trade war will help re-industrialize the economy, that wouldn’t happen for a long time. In the interim, those Americans who elected him to lower inflation may very well find the opposite to be the case.”
And the rest of the world will be moving on, leaving the US to stew in its own corrupt plutocracy, becoming steadily less great. The American auto industry promises to be the prime example of that – heavily protected and thus sentenced to needing protection to cover for higher prices and lower quality.
The entrepreneurial drive, hopes, and needs of the 7.9 billion people living outside the US won’t be stymied for long by Americans’ turning to isolationism and nationalist populism.
Ironically, “Liberation Day” is most likely to mean greater liberty from the American hegemon we have been addicted to. As I’ve argued elsewhere, the tariffs don’t help, but they are the least of what should be our concerns with the United States.
Now what we need is a government prepared to face up to that.
The Reserve Bank continues to ignore market signals and runs the risk of once again leaving the brakes on for too long while being caught in the headlights of uncertainty, Michael Pascoe argues.
Inflation is printing within the target range, growth, both local and global, is expected to weaken, and the labour market’s perceived “tightness” is clearly not inflationary – yet the Reserve Bank of Australia is frozen, unable to make a decision other than to not make a decision.
We’ve hit a dud patch in monetary policy when the money market reckons there is next to no chance the RBA will trim rates at its meeting next week. If the RBA isn’t considering a further cut, what is it doing?
The answer is: dithering.
Despite the data, despite what has already happened to inflation, despite admitting there’s a nine-month delay between the bank lifting its foot a little off the brake and the economy gaining speed, the bank is caught in the headlights by Martin Place’s favourite word: “uncertainty”.
The certainty of uncertainty
Of course, there is “uncertainty”.
If there was “certainty” about the need to move rates, it would confirm that the bank had been too late to move.
The “uncertainty” about inflation rising meant the bank was too slow in lifting rates in 2022 – it waited until it was certain inflation was a problem and thus made it a bigger problem.
The “uncertainty” about the economy’s softness and contained inflationary pressures mean the bank is too slow now in easing rates somewhat closer to neutral and thus will make the economy weaker and unemployment higher.
The “uncertainty” about global trade and growth created by the Trump mobsters strengthens the case for getting ahead of the game instead of playing catch-up. Shallow local commentary suggesting tariffs lifting American inflation means we also need restrictive rates is simply bizarre.
The peanut gallery has trouble realising we are not part of the American economy, unable to move on from last century’s cliché of “if America sneezes, Australia catches a cold”. Happily, we are more part of Asia’s economy. In the GFC, America caught double pneumonia, and we only sneezed.
If the Trumpsters succeed in their punitive tariff folly, the impact on us is most likely to be deflationary as international trade turns away from the US in search of more reliable partners. A weaker economy with disinflationary pressures is a recipe for rate cuts before it comes to pass, not afterwards.
Since the February board meeting, the RBA Governor, Deputy Governor, and head of economics have all had a crack at explaining “uncertainty”, collectively leaving all but the doctrinaire hawks scratching their heads about why the money market should be convinced there will be no movement next month.
RBA and market perceptions are damaged by the national commentariat more interested in domestic political points than the overall economy. Repeating LNP talking points about “Labor spending causing inflation and requiring tight monetary policy” seems to be self-fulfilling with interest rates, such is the desire of the RBA to be at one with money market expectations.
Deputy Governor Andrew Hauser went closest to making the case for further easing rates when he unveiled ($) what the AFR called a “secret chart” showing inflation was in danger of falling below target. Yet the AFR persists with the line that there is “no realistic prospect of another cut in interest rates before the May election”. Why not?
The danger here is that the RBA lives in fear of being tarred with a political brush.
If it did cut rates next week, the usual suspects will claim it was pressured into doing Labor a favour. But pre-emptively ruling out a cut, which is the money market and commentariat’s understanding, means the bank has indeed compromised its integrity and mandate.
After the February meeting, Governor Bullock’s outlook was summarised by her declaring the bank just didn’t know. Of course, it never can know for sure but needs to make a judgement.
RBA chief economist Sarah Hunter last week went long on the “uncertainty” vibe despite spelling out the need for the bank to have a “forward-looking approach” to setting rates. This raises the question of which rear vision mirror the bank is concentrating on to obtain its forward view.
The dreaded “trimmed-mean” is all the rage in RBA land, despite the bank’s actual mandate stipulating the common-or-garden variety of Consumer Price Index.
As I’ve written here before, there seems to be a crazy idea that the trimmed mean somehow predicts the future instead of merely being another measure of the past. It lagged the CPI in picking up that inflation was picking up, a factor in the RBA being late to lift rates.
You would think anyone trying to be “forward-looking” would be most interested in the most up-to-date data, not the quarterly measures, the midpoint of which is months old when published.
The ABS monthly inflation series is proving to be a better guide to turning points that the trimmed mean. No measure is guaranteed to always be closest to the pin with the benefit of hindsight,
but it’s in delivering the vibe of the present that data should be prioritised.
Instead, the RBA gives the impression of ignoring the monthly figures – the figures that had been pointing to the need to cut ahead of the quarterly history.
The latest monthly release was on February 26 for January. It showed the CPI smack on the RBA’s new adopted target of 2.5 per cent and the annual trimmed mean at 2.8 per cent, within the actual mandated range of 2 to 3 per cent. It had been 2.7 per cent the month before.
The next, for February, will be published on Wednesday, nice and fresh for the RBA board meeting next Monday and Tuesday. Another low number around the target would have a responsible board very actively considering an immediate rate cut – unless it was made up of hopeless ditherers, caught in the commentary headlights.
At a glance it might seem a bit of monetary policy wonkery, but the real-world implications are huge, suggesting the RBA Review might cost Labor the election, Michael Pascoe reports.
When the RBA refuses to believe what has already happened over the past year and admits it doesn’t know what is happening now, a difference of 0.2% in its more-often-wrong-than-right inflation forecasting over the next two years should be about as vital for setting interest rates as last year’s wool price.
But thanks to Jim Chalmers’s dubious RBA review, on current polling, it looks like costing Labor the election.
Instead of the first-rate cut in December, the second this week, and indications of another on the horizon, giving Labor some real momentum in slaying the inflation dragon, Albanese will be campaigning on a single begrudged trimming and RBA warnings of no more to come.
A weakened RBA and triumphant Treasury saw Chalmers’ review swallowed without reservation, embraced with apparent enthusiasm even. The result is our central bank effectively ditching the flexible inflation target that had served it relatively well for three decades, replacing it with a straight jacket.
This pleases the doctrinaire hawks who want higher unemployment to push down wages, remembering the good ol’ days of previous administrations when wages suppression was official policy. Too bad that it retards our economic growth and all that flows from it.
Rate cut decision
As was made clear on Tuesday in the RBA governor’s media conference, the bank only pays lip service to its actual mandated target of keeping CPI inflation in the 2-to-3% zone over time. It’s now all about the precise trimmed mean at 2.5%, the midpoint target recommended by the review without any evidence of it being superior.
The result is the RBA being late to the rate cutting party, repeating the mistake of not believing what was in front of it when it was slow to start lifting rates in 2022.
The RBA now knows its precious trimmed mean inflation was running at an annualised rate nicely under 3% over the second half of last year. And, as printed in the Statement on Monetary Policy on Tuesday, the RBA thinks the trimmed mean measure is running at 2.7% cent now and is forecast to stay there for the next two years even if it cuts rates twice more this year.
But, thanks to Chalmers’ review, that’s not good enough to ensure more than this week’s trimming.
Tuesday’s was a most curious and somewhat frustrating Statement and media conference. The RBA is printing one thing but saying another. The bank claims to be “data driven” but it doesn’t believe the data in front of it, let alone the forecasts it publishes.
If it did, Tuesday was a great opportunity for the RBA to give itself a pat on the back.
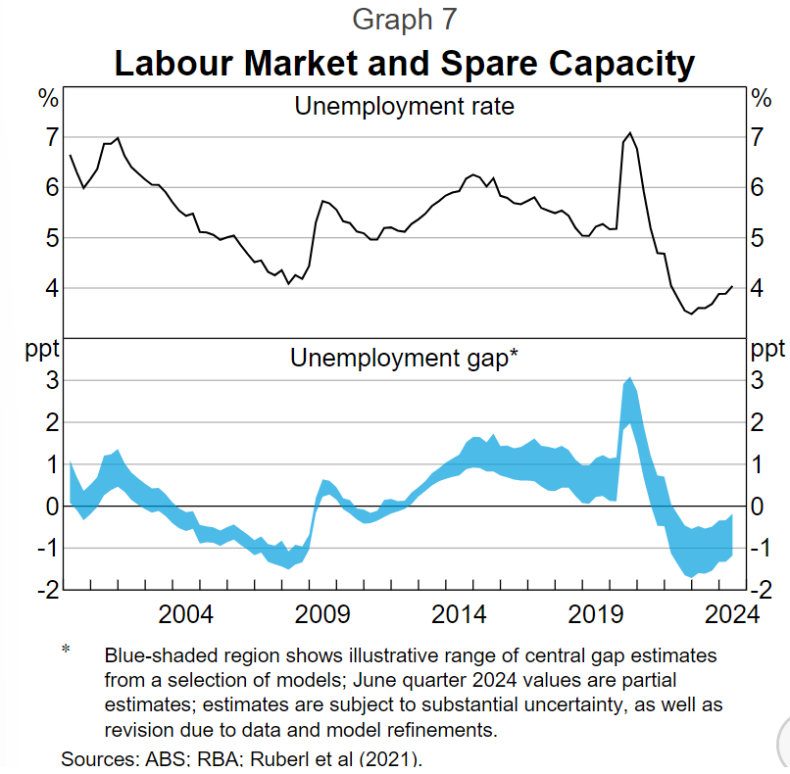
Inflation was brought down within the target range, even within the forecasting margin of error of the silly 2.5%, with a strong labour market and unemployment steady around a lowish 4%. How good is a soft landing on a narrow path?
The outlook, what outlook?
And, thus, yes, the outlook would be for another rate cut on April 1, if only to make up for the one that should have happened in December. Alas, this RBA doesn’t have the courage of having convictions. Despite the data, it’s all too uncertain.
“I don’t know,” admitted Governor Bullock.
With respect, Governor, nobody ever “knows”. Yes, to repeat the cliché, forecasting is hard, especially forecasting the future. Nobody has a reliable crystal ball. Nonetheless,
it’s the RBA’s job to go with what it does have.
And you know what worries the RBA board the most, as explained in the final question of the media conference? The labour market that it is struggling to understand and simply doesn’t believe.
Governor Bullock said it was concern about the tightness of the labour market that was the strongest argument in the board meeting for not cutting rates, that made it a close decision before reaching “consensus”.
The past year has shown Australia can enjoy a strong labour market and unemployment of 4% and disinflation.
The RBA waffles about “full employment” because it doesn’t know what it is, ditto the NAIRU (the non-inflation-accelerating rate of unemployment) that it prefers not to talk about.
The RBA believes the labour market is “tight”, but what it can’t say is whether it is too “tight”. It doesn’t know.
And snap, right on cue, the December quarter wage price index yesterday prints at a low 0.7% for the quarter and 3.2% for the year, another slice of data showing it is not too tight. And snap again, Australia’s biggest business lender, the NAB, reports a profit fall with more borrowers falling behind in their repayments.
I put to Governor Bullock on Tuesday that a year ago, the bank’s statement said it was possible we were at “full employment” but not very probable. After 12 months of unemployment around 4% and inflation falling, the latest statement admits it is “possible” the bank got it wrong. I asked how many months would it take before the bank accepted it got it wrong.
The Governor answered that full employment was a very nebulous concept that you can’t put a number on. The bank was “surprised” that unemployment was still at 4% with a strong labour market and inflation was falling…and the jury was still out.
In the governor’s answer and within the statement document, it is surmised that some of the disinflation has come from profit margins being compressed. It was not stated that this was necessarily a bad thing, but for at least some board members to be pushing back on the “tight” labour market smells to me like a bias on the board towards capital having a greater share of profits rather than labour.
After all, that had been the trend in those good ol’ days.
The simple question for the RBA is that, as it says, monetary policy remains restrictive and if it keeps rates restrictive for too long to chase the review’s 2.5% precise target, a mere 0.2 below what’s happening and is forecast to happen … well, for the want of a nail the shoe was lost and so on.
The latest Productivity Commission report on government services underlines three decades of housing policy failure that the LNP promises to make worse while Labor attempts to maintain the deficient status quo. Michael Pascoe reports.
In a parliamentary fortnight awash with miserable politics, Senator Andrew Bragg tried his very best to land the title of asking the most inane question in either house.
The Coalition’s actual “shadow minister for home ownership”, Michael Sukkar, must have been too busy trying to gag Mark Dreyfus from speaking about the LNP politicising antisemitism, so it was left to Bragg, the shadow assistant minister, to waste the Senate’s time with a particularly dumb effort that he no doubt thought was smart, or perhaps even cunning.
Bragg engaged his full grasp of the housing crisis to pose, “How many houses have been built under the Housing Australia Future Fund agenda?”
Yes, Andy, we can all see what you did there. Of course, none have been built. Given that you partnered with the Greens to delay the necessary HAFF legislation for months in the Senate, you’d know the HAFF could not be established until November 1, 2023.
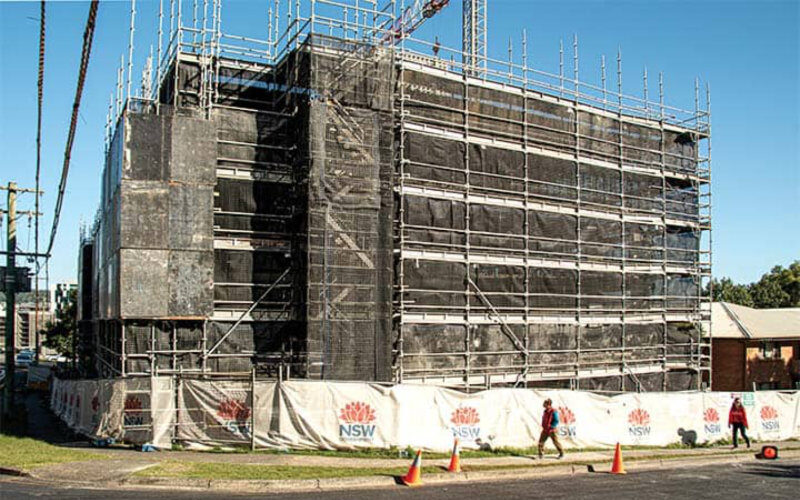
Only then could Housing Australia do the work of finding viable community housing projects, announcing the initial pipeline of 185 last September to deliver more than 13,700 social and affordable homes with the scheme’s first year of HAFF funding. The first 700 HAFF-financed affordable and social homes are scheduled to be finished by the end of this financial year.
And it is reasonably possible Bragg understands it takes time to get stuff built these days. So he knew the short answer to the question would be “none yet”.
Oh, such a gotcha! Indeed, Bragg was so proud he even posted it on his YouTube channel. Such is the Coalition’s dedication to the pursuit of image over substance.
What if the LNP wins?
A much more interesting question would be: “How many social and affordable homes will be built under the HAFF agenda if the LNP wins the next election?”
The answer is the same: none. One of Dutton’s extremely few announced actual policies is to scrap the HAFF.
And therein lies the core difference in what passes for housing policy between Labor and the LNP. Both sides of the party duopoly remain overwhelmingly and hopelessly committed to “the market” solving the Australian housing crisis that is leaving it to “the market” created. However, Labor will try to maintain the insufficient percentage of the affordable and social housing stock, while Dutton’s LNP will happily let it shrink further.
LNP lips curl at the thought of “houso”.
While the housing problem is multifaceted, I hold the unfashionable belief that it is the three decades of policy crime against social housing that has tipped us from “bad” to “crisis”, that our present shortage of housing pretty much equates to what wasn’t built to maintain our 1990s percentage of social housing.
Each year, the Productivity Commission publishes a shame file on our neglect of social housing in its “Report on Government Services”. The 2025 report quietly dropped on January 30.
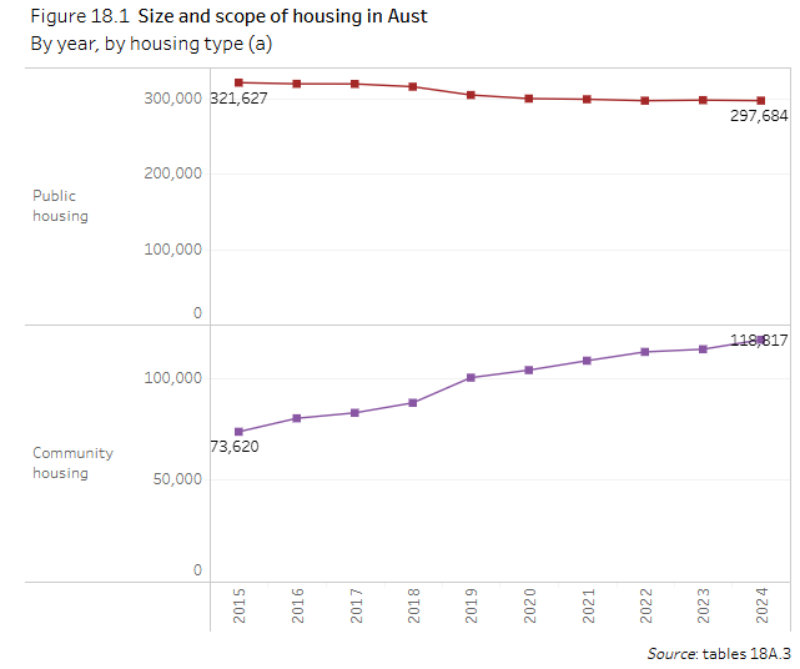
Leaving aside Indigenous housing in a separate category, the PC counted just 3,937 extra public and community housing dwellings last financial year.
That’s 0.95% growth, less than half the rate of population growth, not enough to stop the steady slide in social housing’s proportion of total housing stock, not enough to dint the growing waiting lists for social housing, a.k.a. desperate people in need of affordable shelter.
The latest deficient score is pretty typical of this century and actually considerably better than the nadir reached under the Morrison Government when Sukkar was housing minister. In 2019, there were only 2,325 public out of 202,306 total dwelling completions, 1.1 per cent.
Since 2015, our social housing supply has only risen by 5.4 per cent, an extra 21,154 dwellings. In technical terms, bugger all.
Source: Productivity Commission
The growth in community housing has slightly overtaken the reduction in government-owned public housing as governments have offloaded as much as they could of this difficult responsibility. Encouraging the offload is the ability of community housing to tap into Commonwealth Rental Assistance that public housing tenants can’t.
Declining quality
And then there’s the question of declining quality in the public housing that remains.
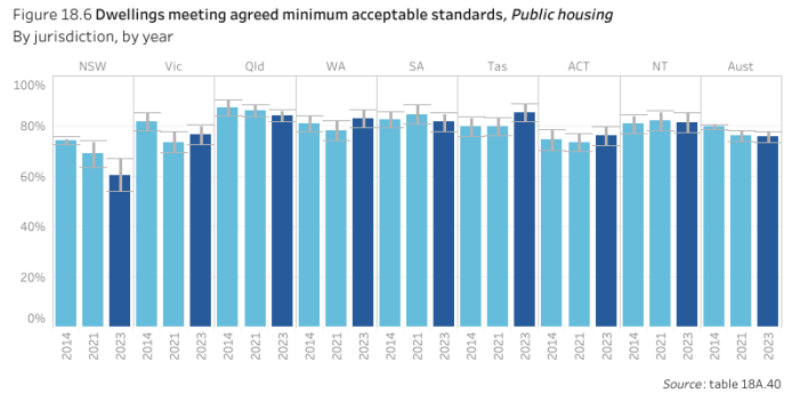
The PC reports that 76% of public housing dwellings in Australia met “agreed minimum acceptable standards” in 2023. In other words, about a quarter did not.
Most of the decline comes from NSW, where only 61% met acceptable standards, down from 74% a decade before.
Community housing scores better, 84% acceptable nationally and 82 per cent in NSW.
Source: Productivity Commission
Standards are relative. Crucially, public and community housing is affordable for those on very low incomes, while the private market is not for most, even with our increasingly expensive Commonwealth Rental Assistance.
I have reservations about using the HAFF mechanism for funding social housing. If these off-balance sheet Future Fund-run honeypots were such a good idea, we’d have one for nuclear submarines and every other major spend. I’d prefer government to return to those heady days of directly funding public builds, both for purchase and rental involvement, as
leaving it to the market demonstrably has not worked.
But that is not going to happen. Public outrage over housing has been successfully diverted into zoning and tax and red tape issues, missing the main game.
A duopoly unable to admit the effect of Howard’s capital gains tax discount certainly won’t go near actually accepting responsibility for housing as a human right and returning to building a hefty proportion of it to keep the developers honest.
So the PC shame reports will roll on. If Andrew Bragg & Co get their way, they will get worse. If Labor continues, they will merely stay bad.
Trump’s much anticipated tariff war is on as the US imposes import duties on Canadian, Mexican and Chinese goods, and those countries retaliate. What does it mean for the world and for Australia? Scott Phillips with some of the answers.
Over the weekend, US President Donald Trump announced 25% tariffs on imports from Mexico and Canada (but only 10% on imported Canadian energy) and an additional 10% tariff on products arriving in the US from China.
Unsurprisingly, Canadian Prime Minister Justin Trudeau has retaliated, putting a 25% tariff on imports from the US. In his announcement, Trudeau was blunt, telling Americans: “Tariffs against Canada will put your jobs at risk, potentially shutting down American auto assembly plants and other manufacturing facilities.”
They will raise costs for you, including food at the grocery store and gas at the pump.
Discussing Canada’s retaliation, Trudeau said, “We didn’t ask for this, but we will not back down”. Canada’s Department of Finance estimates that cross-border trade (in both directions) currently adds up to nearly $1 trillion per year.
Mexico is reserving its options, with plans to announce its own response in the near future.
Weak justification
This is, unfortunately, but not surprisingly, the first of a likely long series of ‘threat, action and counteraction’ scenarios we could see play out over the next four years.
And it’s hard to separate the politics from the economics because, frankly, the economic justification is as weak as the foreign policy one.
Donald Trump claims this decision was made primarily in response to imports of the drug Fentanyl from Canada to the United States.
Notwithstanding that border controls are universally about policing imports, not exports, as recently as 2020, the United States Drug Enforcement Agency found that “China remains the primary source of Fentanyl and Fentanyl-related substances trafficked through international mail and express consignment operations environment, as well as the main source for all fentanyl-related substances trafficked into the United States.”
“Some fentanyl products are smuggled from Canada into the United States for sale, on a smaller scale”
Perhaps things have changed meaningfully since, and Canadian fentanyl is the new overwhelming scourge.
Perhaps, but that data makes the above-mentioned tariffs seem just a little disproportionate. If the 25% tariffs are necessary, why only 10% on energy?
One might suppose that the price of petrol is more important than the self-declared war on Fentanyl. Then again, given more of it comes from both China (10% higher tariffs) and India (no tariffs, yet at least) – and that there’s been no concurrent action on drugs inside US borders – one might question whether the war on drugs is really the motivation it’s claimed to be.
Who pays?
Former US Treasury Secretary Larry Summers has, overnight, suggested that tariffs could increase US inflation by 1% over the next nine months. And, as we know well from the experience with inflation over the past five years, when prices go up, they tend to result in a permanent reduction in living standards.
Trump has acknowledged the potential impact (though characteristically hedging his bets), posting (in capitals, of course) on social media:
WILL THERE BE SOME PAIN? YES, MAYBE (AND MAYBE NOT!).
Which is the stupidity of tariffs. While the political spin is ‘tariffs on Canada’ (Mexico, China…), the tariffs aren’t paid by those countries but by US consumers.
And then, predictably, those countries retaliate, putting tariffs on imports from the US, pushing prices up for, in this case, Canadians. It is a textbook lose-lose scenario.
But what about ‘making things again’? Isn’t that a justification?
Well, American unemployment is 4.1%. Maybe a small minority of those people have skills that could be directly and immediately applied to new US manufacturing. That is, after new plants are built, machinery is bought (from overseas?), and operations commence, which would take years.
And that assumes those businesses were prepared to make capital investments given the risk that such investments may not be economically feasible if a future administration were to roll back tariffs.
Regardless, most of those unemployed Americans wouldn’t have the right skills or be in the right places, anyway. So then 100% of Americans would be paying more, but for almost no meaningful employment gain.
What about Australia?
That’s the problem (and we hear echoes here in Australia) with ‘we should build things here’
We absolutely should, if it makes sense; if the workers would earn more than they do now if consumers of those products will pay less than they do now, if the quality of the products would be better than they are now, and if we don’t have to tip more government spending into the endeavour.
Also, I’d like a unicorn.
See, that’s the benefit of free(r) trade: we sell them things we do better and/or cheaper, and we buy things they do better and/or cheaper. It’s not perfect, but it’s a very good way to improve living standards in both countries.
Tariffs reverse all of those things. Either we pay more for imports, or we pay more for locally produced alternatives. Think that’s a good thing? Because it supports ‘local’ jobs and products? It seems like it at first. But if you’re paying more for Product A, you can’t buy as much of Product B (or buy Product B at all).
Your living standards fall, and the business making Product B goes broke, and those workers lose their jobs. Something that started sounding good at first blush, suddenly seems more complex and maybe a bad idea after all.
If it’s easier to conceptualise, consider if there were trade tariffs across Australian state and territory borders. Queensland bananas would cost more in NSW. NSW-made steel would cost more in Queensland.
NSW workers wouldn’t be any better off, but the bananas would cost more. Queenslanders would pay more for steel and get no benefit from the higher price of the produce they send south.
But for now, at least, there’s little direct impact on Australia. That doesn’t mean there won’t be any impact, though.
International tariffs
Higher tariffs on Chinese imports into the USA will almost certainly reduce demand for those products. And I don’t need to remind you that China is our largest trading partner. According to DFAT, China bought $219 billion worth of Australian exports in 2023, fully one-third of everything we sent offshore.
So it’s probable that any Chinese economic impact will have echoes in that country’s demand for Australian exports.
Beyond that, it’s anyone’s guess. Will Trump pick a fight with Australia? We would have assumed not, but he picked a fight with Canada, the US’ long-time ally, with which it shares an 8,891km land border.
And how would the Australian government, before and/or after the next election, respond?
At the moment, Trump appears to be two parts schoolyard bully (tariffs and bluster), one part 17th century king (executive orders aplenty) and one part Roman emperor (with designs on Greenland, the Panama Canal and, yes, Canada).
Perhaps the rest of the world comes to an explicit or implicit agreement to build and maintain multilateral trading partnerships to reduce the potential and actual impact of a volatile and demanding United States.
Or individual countries might try to curry favour with the US administration by deciding to play Trump’s game, for the short-term financial benefits that could accrue.
Individual companies would be well-advised to meaningfully and quickly diversify their international customer bases, much as many had to do when China put tariffs on Australian products in 2020.
What’s next?
Economic types have long said that when the US sneezes, Australia (and other countries) catch a cold. While inflation is the immediate threat, any significant disruption to trade could risk global economic growth, too.
With my investor’s hat on, the immediate impact will be on the profitability of businesses with significant cross-border trade between those jurisdictions. There aren’t many ASX-listed businesses selling much from US factories into Canada or Chinese plants to the US, thankfully.
We should prepare for more global market volatility, though, as investors try to work the announced and potential changes into their assessment of value. The ASX fell 2% out of the gate this morning. I don’t do predictions, but I think we can assume we should expect the unexpected, from here.
Oh, and a reminder that Trump has only been in office for 2 weeks. It’s going to be a helluva ride.
While the pundits focus on next week’s interest rate move by the Reserve Bank, the job market is the strongest it’s been for a long time. Alan Austin reports.
The latest figures from the Bureau of Stats (ABS) show the workforce has expanded by more than 3% in each of the last three years. This is unprecedented since the Bureau began keeping records.
Those rises were 3.35% in 2022, 3.19% in 2023 and 3.15% last year. That expansion of 1.38 million new workers in three years may well be the greatest in the developed world, relatively speaking.
That this has happened without a blow-out of the jobless or even a dip in the participation rate is quite remarkable.
The only other time Australia registered two straight years of workforce expansion above 3% was in 1986, when the jobless rate was 8.36% and the participation rate (see below) a mere 61.93%.
More jobs for more applicants
Of the extra 919,500 Australians in the workforce in just the last two years, the vast majority went into paid jobs.
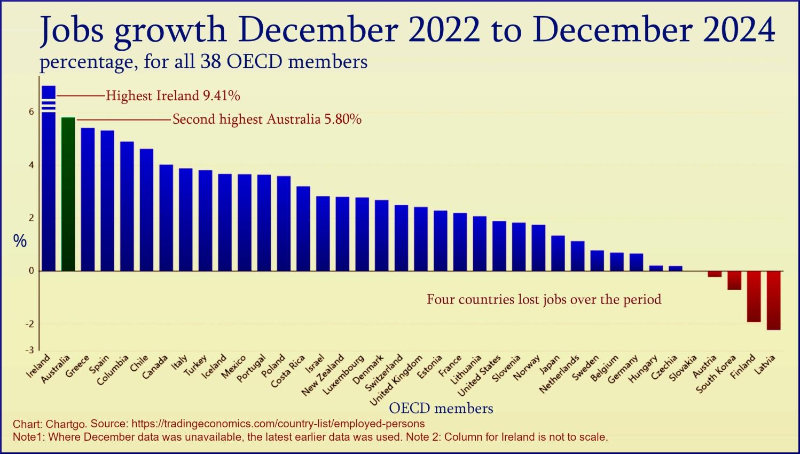
According to the data at Trading Economics, only four of the 46 nations comprising the Organisation for Economic Cooperation and Development (OECD) and the G20 enjoyed employment growth over those two years above 5% – Ireland, Australia, Greece and Spain. Australia ranked second.
Australia’s jobless rate has remained below 4.25% for the entirety of the Albanese Government and, in total, for 37 months. That has not happened since ABS records began in 1966. The female jobless rate has been below 4.1% throughout the current term, also a first.
December’s unemployment rate of 3.98% now ranks ninth in the OECD. That’s up two places from the previous year, easing ahead of the Czech Republic and, for the first time ever, Norway. That compares with ranking 23rd in June 2020.
Jobs by Prime Minister
The tussle between political parties over which administration generated more jobs is no longer close. Albo is streets ahead.
These are the rankings on jobs created per year as a percentage of employed workers:
Anthony Albanese:
3.13%
Bob Hawke:
2.48%
John Howard:
2.37%
Malcolm Turnbull:
2.31%
Paul Keating:
2.02%
Scott Morrison:
1.93%
Kevin Rudd:
1.60%
Julia Gillard:
1.44%
Tony Abbott:
1.35%
Malcolm Fraser:
0.83%
Surge in full-time jobs
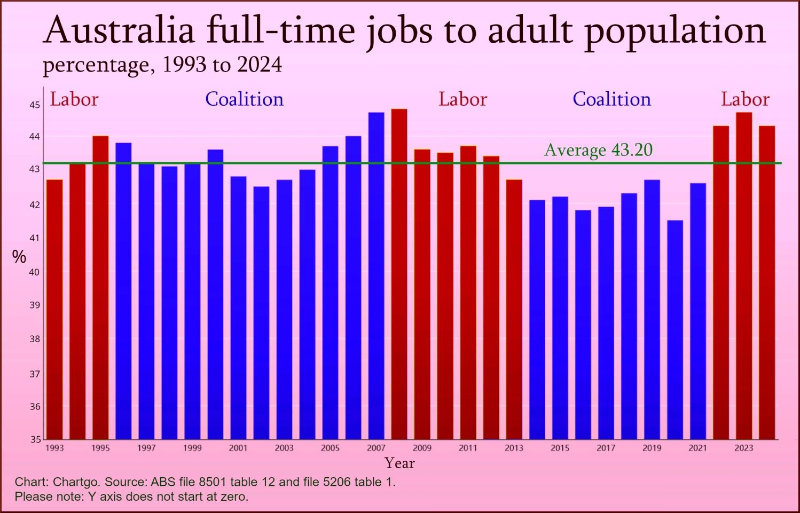
Full-time jobs as a percentage of the adult population hit a 34-year high annual average of 44.74% in 2023. Last year’s 44.30% was almost as strong. The last three years have all exceeded 44.30%, well above the long-term average of 43.20%. The Coalition averaged just 42.14% in its recent eight-year reign.
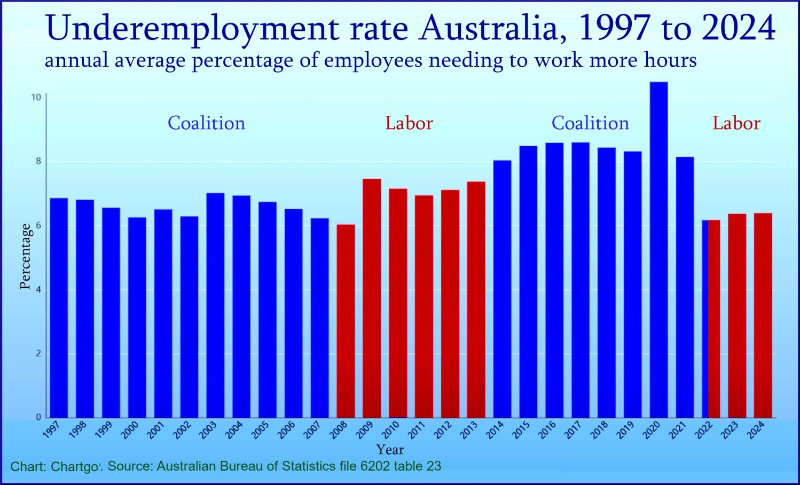
The flip side of this is the underemployment rate – the proportion of the labour force with jobs but working insufficient hours for a satisfactory income.
Through the recent Coalition period, this fluctuated between 7.5% and 13.0%. It has now settled between 5.8% and 6.7%.
Participating in the economy
For some decades the difficulty of finding a job discouraged potential workers from even signing up to look for one. This was quantified by measuring all workers plus job seekers as a percentage of the population – and called the participation rate.
This fluctuated between 62 and 65% through the Howard years and between 64 and 66% during the more recent Coalition period.
Those days appear gone. The participation rate hit an all-time monthly high of 66.71% in March 2023, then two more record highs later in 2023. Last year, this reached three all-time records, including December’s 67.13%.
The figures also show that there are more jobs for 15 to 24-year-olds.
Youth and young adult unemployment was 9.05% in December, with the rate steadily declining. This has been below 10% for the last nine months. That compares with the 12.49% average through the Turnbull period and 12.02% under Morrison.
Debunking jobs myth
Canadian economist David Card won the Nobel Prize for economics in 2021 for demonstrating that raising minimum wages doesn’t cost jobs and that immigration doesn’t lower incomes of native-born workers.
He and other Nobel laureates, including Claudia Goldin, Paul Krugman, and Joseph Stiglitz, have claimed – controversially – that governments directly shifting wealth and income from the top to the bottom is actually constructive in achieving desired economic outcomes for all citizens.
It’s hard to find a better example of Card’s theories in practice than Australia under Albanese and his treasurer, Jim Chalmers.
They have aggressively increased pensions and benefits, pushed for higher minimum wages, shifted the tax rates in favour of low-income workers, made it easier to prosecute wage thieves, handed cash to families to help pay energy bills and employed more government workers in strategic sectors. All while allowing high migrant inflows. This is Card’s fever dream.
That said, there is still much work to be done to reduce the overall cost of living, halt the ever-increasing housing costs and reduce inequality.
Australia is now the only economy in the world in budget surplus, with triple-A credit ratings and continual GDP growth for the last ten straight quarters. It is also the world’s only economy with a jobless rate below four percent, inflation below three percent, and median wealth per adult above US$250,000.
Australians are among the wealthiest people on the planet yet life has never felt harder for many. How can this be? asks Harry Chemay.
A new research paper has highlighted the plight of middle Australia, which has, over the past two decades, experienced a fall in economic circumstances relative to both low and high-wealth households.
This squeezing of middle Australia coincides with and exacerbates, the cost-of-living crisis of the past few years, mostly borne with outward stoicism and an irreverent sense of humour.
Not without good reason has ‘cozzie livs’ entered the Australian lexicon, as rising living costs post-COVID have impacted all aspects of life Down Under, from renting to health care to the ability to put enough food on the table for some.
Increasing household financial stress is further evidenced in recent data from the Australian Bureau of Statistics (ABS), which indicates nearly 1 million workers (almost 7% of employed people) now have more than one job.
It might be tempting to presume that it is lower-skilled workers who are being forced into a ‘side hustle’ out of economic necessity, but the data reveals instead that professionals dominate by number, with more than 300,000 currently holding multiple jobs, a rate of over 8%, as the below chart shows.
Source: Australian Bureau of Statistics, Multiple Job Holders, Sept 2024
Life has never felt harder for middle Australia, yet we are, on average, amongst the richest people on the planet. How can these two opposing statements co-exist and both be true?
The Melbourne Institute’s Applied Economic & Social Research Centrepaperdelved into wealth inequality in Australia for the period 2002 to 2018. By using this pre-COVID period, it reveals longer-term factors predating, and thus not influenced by, the pandemic that shaped changes in wealth inequality since the early 2000s.
Using a survey run by the Melbourne Institute, one that has tracked the changing economic and social circumstances of the same participants since 2001, the researchers looked at household wealth in 2002 and then every four years thereafter until 2018.
All components of household wealth were considered, including financial assets such as superannuation, bank accounts, shares and other investments. Non-financial assets incorporated the primary residence (if a homeowner), together with any investment and holiday properties, business assets, collectibles and vehicles. Liabilities such as mortgages, credit card debt, business debt and educational loans (HELP and VET) were captured but deducted from assets to focus on net wealth outcomes.
The outputs were then divided into different wealth groups to primarily capture high-wealth households (those in the top 90%), middle-wealth households (at the middle 50%) and low-wealth households (in the bottom 10%).
The study’s results indicate that low-wealth households saw their net wealth increase from $15,313 in 2002 to $28,000 in 2018 on average, an increase of 82.9%.
Middle-wealth households saw a lift from $340,623 to $520,300 over the same period, a lift of 52.7%, while high-wealth households experienced an increase in net wealth from $1,349,548 to $2,224,400, growing 64.8% in that time.
Importantly, the researchers noted that the absolute gap between different groups diverged over the 16-year period. While the gap between high and low-wealth households increased by 64.62%, and the gap between middle and low-wealth households grew by 51.36%,
the largest rise was between high and middle-wealth households at 68.90%.
The report noted, in appropriately neutral academic speak, that there “is some evidence here of a ‘disappearing middle’ as the relative wealth position of those in the middle of the wealth distribution worsens”.
Housing the driver
To understand the factors driving this ‘disappearing middle’, the researchers then analysed net financial wealth and net property wealth separately.
In financial wealth terms, low-wealth households increased their circumstances on average from $2,775 to $9,200 over the 16 years, a change of 231.6%. The researchers noted superannuation as a possible reason for this significant uplift. Middle-wealth households increased their financial net wealth from $75,989 to $152,900, a 101.2% uplift. High-wealth households saw an increase in net financial wealth from $609,403 to $934,766 on average, an uplift of 53.4%, with the Global Financial Crisis of 2007-08 disproportionately impacting this group.
Turning to property wealth however, the results essentially invert. The low-wealth households, on average, had zero property net wealth at every survey point across the 16 years, evidencing the difficulty in becoming property owners for lower-income households.
Middle-wealth households saw a lift in net property wealth from $221,279 to $290,000, a rise of 31.06%. High-wealth households, in contrast, saw net property wealth rise from $737,598 to $1,250,000 on average, a lift of 69.47%.
The chart below depicts the net wealth positions of each household type across financial, property and total net wealth across the study period.
Source: author’s analysis based on data in the HILDA working paper (2024)
In 2002, property wealth for high-wealth households was 3.1 times that of middle-wealth households. By 2018, it had increased to 3.4 times, and the absolute dollar gap in net property wealth separating these two groups had increased from $332,000 to $1.1 million.
This ‘disappearing middle’ phenomenon appears to be exacerbated by ever-escalating residential property prices and the increasing debt burden carried by middle-income Australians to enter, and stay in, the property market.
The Melbourne Institute paper is but the most recent in a long line of research that all points to the same underlying cause: high and rising residential property prices, relative to incomes, that over time,
concentrates property wealth in the hands of fewer, generally older, households.
With $11 trillion in residential property compared to $4 trillion in superannuation, it is property that has an outsized influence on Australian household wealth and who holds it.
This distribution of wealth is linked to declining property ownership, particularly in younger households, with the researchers noting that for the adult population, the share of those owning no property at all (the ‘property poor’) increased from 29% to 32%.
Growing property wealth inequality is detectable at the other end of the age spectrum, too. While those 65 and over with no property increased from 32% to 34% during the study period, those with two or more properties increased from 13% to 15%.
As lead author of the paper, Dr Melek Cigdem-Bayram noted:
“Australia’s worsening housing affordability crisis is locking people out of homeownership – a traditional path to economic stability for middle-income earners. As wealth inequality is increasingly concentrated in fewer hands, it entrenches economic instability and exacerbates poverty.”
The acceleration of that trend since the early 2000s has served to inflame the Housing Hunger Games that is Australia today.
The Big Four banks are betting the Australian Bureau of Statistics on Wednesday will deliver the verdict that the RBA has been wrong on interest rates. Not that they’d dare phrase it that way, says Michael Pascoe.
It’s a brave soul who bets on what ABS statistics might be, but that’s what the money market in general and our big banks in particular do. They are making a big bet that this Wednesday’s CPI numbers will show the RBA has got monetary policy wrong, that rates should have been cut in November, if not considerably earlier.
Three of the Big Four reckon the much-ballyhooed “trimmed mean” inflation measure will come in at 0.5% for the quarter. The fourth bank (Westpac) is only a bee’s appendage higher by rounding up to 0.6.
Averaging the four, the alleged underlying inflation measure over the past half year is expected to annualise at 2.5%, right smack in the middle of the target the RBA seems to have adopted since swallowing the dubious Treasury review of its operations.
As for the “headline” CPI, the thing our central bank is actually mandated to target but ignores, three of the four tip it to be up 0.2% for the second consecutive quarter, making 2.4% over the past year and just 1.6% annualising the last six months.
So why didn’t the RBA trim rates in November? Because it does not have a good handle on what the economy is doing, relying instead on dud modelling, just as it has no idea of what the NAIRU (non-inflation-accelerating rate of unemployment) might be.
While deciding to keep the monetary screws turned at its December 10 meeting, the RBA board was sticking with its forecast of trimmed mean inflation for 2024 being 3.4 per cent and not hitting its 2.5 per cent nirvana for another two years.
Of course, all the commercial banks’ highly-paid forecasters could yet be proven wrong on Wednesday, with the RBA the only one marching in step, but I suspect the Martin Place mandarins are feeling a little nervous about the figures.
As the CBA economics team put it:
The December quarter CPI report will make or break the case for the RBA Board to reduce the cash rate at their next meeting.
The CBA is our biggest bank and therefore, through its customers, the mob that should have the best feel for what is happening. The economics team highlighted that there have been growing signs that the disinflationary pulse firmed over the past two months.
“For one, both the October and November CPI reports contained strong price signals confirming this trend,” the bank reported. “And price signals from various timely consumer and business surveys also corroborate this trend.”
RBA relies on modelling
The RBA board had both of those ABS monthly CPI figures to consider at their meeting last month but stuck firm with their modelling.
Should the December quarter trimmed mean print at 0.5 or 0.6, the opportunity is there for the Governor to spin it as our mighty central bank’s great victory over inflation, proving that keeping rates where they were set in November 2023 was exactly the right medicine Australia needed and here’s a 0.25% rate cut to reward all those have been suffering for doing such a good job of suffering.
That’s much more palatable than putting it the way the CBA did when making its annualised trimmed mean forecast:
“That is to say, underlying inflation over the second half of 2024 tracked at the midpoint of the RBA’s inflation target.”
It should be very embarrassing for the RBA not to have noticed that, not to know where inflation was.
In such circumstances, any credibility about its forecasting of inflation in a year or two’s time is shot.
Remember that while the cash rate was held steady, monetary policy was still tightening over those six months when the CBA thinks the trimmed mean was on target. According to the RBA itself, all the effect of the November 2023 rate increase was not expected to be through the system until the end of 2024.
Monetary pain
After the last February meeting, your humble scribe dared write a contrary article that seems to have aged rather well, pointing out that the monetary pain would continue to be increased and also highlighting a telling admission in the Statement on Monetary Policy.
“Given the substantial uncertainty involved with each of the model estimates, it is possible that labour market conditions are already consistent with full employment,” the statement said before adding the rider that the probability was relatively modest.
At the time of that meeting, the latest seasonally adjusted unemployment rate was 4 per cent, which is where it has more-or-less remained over the past year as inflation has more-or-less steadily fallen, proving that the “possible” of February 2024 was the reality.
The central bank has spent a year pursuing its goal of 4.5 per cent unemployment, wanting more people unable to find work because it has persisted with failed modelling that has never been able to compute an inflection point until long after the event.
On Wednesday we’ll find out if the RBA has the ticker to own that mistake or would prefer to obfuscate.
You might think the bank will have mixed emotions if the CPI does land as low as the market expects.
PS> There seems to be a common misconception that the trimmed mean inflation measure forecasts where the headline CPI will end up. It does not. At the end of 2021, the CPI was 3.5%, the trimmed mean 2.6%. The RBA didn’t start (belatedly) lifting rates until May 2022. It would have done better concentrating on the headline number.
This post was originally published on Michael West.
The monetary policy galahs are squawking their usual lines about a strong labour market preventing the RBA trimming rates next month, but Michael Pascoe argues the RBA’s integrity will be open to question if it doesn’t cut.
The labour market is actually saying the Reserve Bank has been woefully wrong.
“You had one job,” as the saying goes, a job of great importance to the commonwealth’s welfare, of crucial importance to the precarious welfare of hundreds of thousands of people. You wouldn’t want to get it wrong.
All the more so when your reputation is on the line, when you’ve been very publicly defending your performance of that job for months on end, assuring the nation you know what’s best.
In such circumstances it is very difficult to admit you’ve been wrong for all those months, that you’ve caused unnecessary pain and suffering. It’s very tempting to prevaricate, to stick to your wrong course, or at least to try to slide away from that course rather than own the mistake and deal with it smartly.
But that makes for a bigger mistake. Getting something wrong is a matter of competence. Not owning the mistake is a matter of integrity.
It is the Reserve Bank of Australia’s integrity that is open to question when it meets next month.
Monetary policy
Monetary policy is a very inexact science, an inevitably clumsy art given its blunt instrument. Mistakes are inevitable.
Integrity, though, having the ticker and conscience to recognise and own a mistake, is a matter of character.
The problem facing the RBA staff and board is that, however they spin it, trimming rates next month will be an overdue admission of being wrong about the labour market and inflationary pressures.
The kindest interpretation of the mistake is that the RBA leadership is relatively inexperienced at the sharp end of monetary policy and thus fell captive to “the model” – the projections spat out by the RBA’s computers based on old data.
A flawed model
in November, the RBA’s model told the Governor she needed an unemployment rate of 4.5 per cent by the end of this year and ever after to get the trimmed-mean inflation measure down to 2.8 per cent. The model, based on old data, believes the NAIRU (the non accelerating inflation rate of unemployment), is 4.5 per cent.
This, demonstrably, is horseshit. Inflation has been consistently falling, not accelerating, with unemployment around 4 per cent or lower for the past two years.
It’s a little simplistic but not wrong to say an unemployment rate of 4 per cent is a DIRU, a decelerating inflation rate of unemployment.
So bad is the model the RBA has been relying on that it spat out a prediction of 4.3 per cent unemployment for December. Duh, actually 4 per cent, according to the ABS on Thursday.
As every wannabe computer modeller should know, “garbage in, garbage out”.
The bank and the federal government have been playing silly buggers with language when it comes to their desire for higher unemployment. Talk of the NAIRU is out of fashion. “Full employment” sounds so much nicer, but the RBA is fibbing when it pretends it knows what full employment is other than a euphemism for NAIRU. And, as demonstrated, the RBA does not know what that is.
RBA track record
This is by no means the first time the RBA has proven its uselessness when it comes to understanding the labour market and its links with inflation. It’s a uselessness not limited to our central bank, either.
A friend with an eye for such things provided a 1998 quote from economics journalist Samuel Brittan:
“Estimates of the natural rate of unemployment are not constants of the universe. Most attempts to estimate them embody what Friederich Hayek called in his Nobel Prize address ‘The Pretence of Knowledge.’ They do not provide a basis for deliberately slowing down an economy when, as in the US at present, there is no sign of inflation….”
Outdated text books and models
The RBA and several of the more obvious galahs in the monetary policy game have been suggesting the “tight” labour market is a barrier to trimming interest rates. They continue to do so despite all the evidence to the contrary, and only outdated textbooks and models are in their favour.
The inexperienced RBA leadership – not one of the top three has ever been involved in making the big call of reversing monetary policy – may lack the cultural memory of the last time the bank got its NAIRU fixation seriously and painfully wrong.
They’re not alone. Much of the commentariat has trouble dealing with history as ancient as last decade.
Just 10 years ago, trimmed mean inflation was around the mid-point of the RBA’s target range, with unemployment at 6.1 per cent. The inflation rate then started falling, dropping below the target range in early 2016 and staying there until COVID. At the same time, the unemployment rate was falling, down to 5 per cent in December 2019.
The cash rate was trimmed to 1.5 per cent in August 2016 and stayed there for nearly three years despite all the evidence of having a DIRU and weakening economic growth. By the time the RBA started trimming rates in June 2019, it was too little, too late, to battle the surplus-obsessed federal government. And then came COVID.
Already too late
As previously argued here, the RBA should have cut its cash rate in November. Pretty much all the data since then have confirmed that sitting pat, believing its dud model, was a mistake.
By their very nature, models are incapable of picking up a shift in the NAIRU. The data they are fed only reflect the change long after it has happened after the wounded have been bayoneted and the innocent blamed.
This is why the RBA’s integrity will be on show at the February meeting.
The Governor can stick up her hand and say, yes, the bank has been wrong and the cash rate must be trimmed.
The blow can be softened with a couple of the usual phrases, “acting out of an abundance of caution” and “with the benefit of hindsight”, but the necessary and overdue cut next month will effectively be an admission of making a costly mistake.
There already is a question about competence in the way the present RBA board and management acquiesced to a dubious Treasury reinterpretation of its mandate. As far as it is possible to understand RBA speak, the target of the CPI being in the range of 2 to 3% over time has been replaced with an underlying inflation measure being 2.5%.
Now, anything less than admitting its NAIRU mistake will question both the bank’s competence and integrity.
Contrary to what you might read in the AFR or Murdoch press, Treasurer Jim Chalmers has been doing a solid enough job, writes Michael Pascoe, but he’s suddenly looking desperate.
Jim Chalmers has been one of the steady hands as the good ship Albo began to drift over 2024. He has stayed steady despite being the target of a constant and consistently inane campaign by the two national dailies and their fellow travellers as they try to blame this year’s little budget deficit for inflation.
This is the doctrinaire and/or cynical mob that would like to have a full-blown recession, which they could then blame on Labor after blaming Labor for not having a recession.
I’ll come back to the shallowness of the Labor’s-deficit-is-causing-intolerable-inflation argument, but first is the problem of Treasurer Jim losing it on an inconsequential hill at the behest of a lobby as richly self-interested as any to be found this side of Big Tobacco. It could be symptomatic of a government suddenly desperate to appease minor-but-rich interest groups instead of concentrating on the main game.
In the peak silly season between Christmas and New Year silly, Chalmers blew it by declaring designing and playing poker machines could be an important part in modernising “and innovating” Australia’s financial system, that if Donald Trump thinks it’s a good idea, we need to as well, and that, while there’s plenty of crime involved, it’s growing and legitimate a fair bit of the time, so try to look on the bright side of life, da-dum, da-dum, da-dum da-dum da-dum.
OK, he didn’t actually say “poker machines”. (Labor at Federal and State level is already owned by that industry anyway.) But he may as well have. In fact, it might have been better than endorsing the crypto bros as the future of Australia’s financial system.
“Cryptocurrencies such as bitcoin will help drive modernisation of Australia’s financial system, Treasurer Jim Chalmers has declared while revealing the re-election of Donald Trump has already forced a rethink of the emerging sector’s importance.
“Chalmers said while there were legitimate concerns such as the use of crypto by criminal elements, the possible advantages from the creation of new investment opportunities should not be curtailed by overzealous regulation.”
I have no idea whether Chalmers allowed himself to be spun into a SMAge reheat of a four-week-old press release or whether his handlers placed it through ill-thought attention seeking. In either case, it is faith destroying.
FFS, Jim, crypto only has three purposes: criminal payments, unproductive speculation, and undermining the financial system. OK, maybe four uses, if you think feeding anarchist conspiracy theories is a use.
RBA not so keen
It’s why the RBA doesn’t want a bar of it, having investigated the possibilities of central bank crypto currencies in particular and crypto in general, and realising the danger of opening that Pandora’s Box. It might sound good after snorting a few lines to cut banks out of the game, but it also would totally stuff the economy.
The weekend story added a dash of Trump to reheat a December 4 press release that passed without much notice.
The Treasury release was a jumble of words to appeal to the crypto bros around not much, just that the government “takes the crypto industry seriously and we know that blockchain and digital assets present big opportunities for our economy, our financial sector and innovation”.
It boiled down to the Australian Securities and Investments Commission working with “stakeholders” i.e. the crypto lobby “to update its advice on digital assets, including cryptocurrency”.
Little harm done, the lobby thrown a bone that won’t amount to anything before the election and giving Labor’s biggest crypto fanboy, Andrew Charlton, something with which to compete with the Liberals’ Andrew Bragg in duchessing the interests of potential industry donors.
But now Trump has gone crypto bananas, richly rewarding his crypto backers with the promise of creating a “strategic bitcoin reserve”. This is a policy with no purpose beyond further boosting the price of bitcoin for the bros who already own it.
To restate the obvious, bitcoin and its many cousins have no purpose beyond a means of making secret payments and gambling that there will always be a greater fool willing to pay more for something that has no intrinsic value.
That there is an effectively limited number of bitcoins is the only thing going for them, aside from usefulness for criminals to be able to receive payment for ransom, blackmail, terrorism, drug and arms shipments.
Chose your friends wisely, Jim
Of the many looming cases of crony capitalism in the Trump administration, the bitcoin payoff has been the quickest and crudest. The crypto bros have the cash to splash and are doing it, overtaking the usual oil, Koch and finance suspects to become the biggest US corporate buyer of politicians, or political donors, as they like to call it.
And the money is used to punish as well as promote.
The crypto industry spent $US40 million to defeat Ohio Democratic Senator Sherrod Brown in November. Brown was the Senate Banking Committee chair and no fan of crypto. Crypto replaced him with Bernie Moreno, a former luxury car dealer and “blockchain entrepreneur”.
The crypto lobby, Stand With Crypto, which launched in Australia last month, targeted Brown for making such statements as looking at cracking down on cryptocurrency to cut off the sources of terrorism finance. (https://www.standwithcrypto.org/politicians/person/sherrod—brown ) How dare he.
The Public Citizen think tank counted crypto as contributing 44 per cent of all US corporate federal election donations this year. For their US$119 million (that Public Citizen knows of and not counting Elon Musk as a crypto donor), Donald Trump was turned from a crypto critic into a grateful fan.
You pays your money, you gets your monkey. Trump has nominated crypto-friendly Paul Atkins to be head of the Securities and Exchange Commission, replacing Gary Gensler who attempted to clamp down on the wild west crypto market.
Stand With Crypto is no doubt delighted with Jim Chalmers so soon after going public here. The SMAge’s David Swan reported on the launch event:
Pro-crypto lobby group Stand With Crypto is hoping to capitalise on a wave of momentum from Donald Trump’s decisive US election win, launching in Australia to push for crypto-friendly legislation and fight the technology’s “crypto bro” image problem.
Using a flashy drinks event at Melbourne’s National Tech Summit to mark its launch Down Under, the advocacy group has met with MPs and senators over the past week to push for what it says is “sensible” legislation to regulate crypto firms operating in Australia.
The group has been launched by Coinbase, the United States’ largest cryptocurrency exchange, and is hoping that Australian politicians will be spurred into action after witnessing crypto’s role in the recent US poll. The cryptocurrency sector won big in the elections: Trump promised the US would become the bitcoin superpower of the world, and the sector raised more than $245 million from a mix of corporations and individual contributors to elect pro-crypto candidates.
The crypto sector outspent oil companies, banks and Elon Musk on the election. Stand With Crypto developed a grading system for candidates across the country, rating them from F to A on their stances.
“Our goal is to shift the narrative from crypto being viewed solely as a speculative investment to recognising it as the future of finance and the internet,” Tom Duff Gordon, vice president of international policy at Coinbase, told this masthead.
Right …
Australians proverbially will bet on two flies crawling up a wall. As the world’s biggest gambling losers, plenty have added the opaque crypto game to their choice of casino. It would be nice if this racket is at least tightly regulated to make it a little harder for the scammers and fraudsters such games attract, but that’s not what the industry wants.
As in the US, the industry has money to spend on friendly politicians and punish those who are not.
Along the way, we can expect plenty of bullshit, such as crypto being “the future of finance”. Spinners gotta spin, but the Treasurer regurgitating such crap is a worry. He is supposed to be better than that. He needs to be better than that.
Bigger fish to fry … pundit fish
Besides, Chalmers should have much more important things to do. He has been unable to counter the constant “your deficit is keeping interest rates high” chant.
A little perspective. The latest estimate of this year’s deficit – after a couple of surpluses – is $26.9 billion, a bit less than one per cent of GDP and just 3.7 per cent of total federal spending.
At the theoretical margin at which the lightest-weight economists operate, yes, that is a sliver of fiscal stimulus, as opposed to fiscal tightening to further throttle a weak economy, but it’s only a sliver.
By comparison, the latest ABS count of household spending is $879 billion in the year to the end of October. This year’s deficit is a wee fraction of that, a fraction that is nevertheless helping keep unemployment low. To use a technical term, it’s bugger all to all but the most useless economic pedants.
If the national dailies wanted credibility instead of political points, they should be more interested in running a campaign attacking our ramshackle tax system, but not from the point of view of rich people wanting to pay less tax.
Instead, they would underline that we are relatively lightly taxed and the biggest lurks and failures in our system outrageously favour the top 10 per cent – the capital gains tax discount, overly generous superannuation concessions, trusts, negative gearing et al. I know, because I am one.
And too bad Jim Chalmers is talking bullshit about crypto instead of taking the ball up on real reform. A sign of desperation.
Australians owe $2.3 trillion in mortgage debt, three-quarters of which is owed to the Big Four banks, a cosy oligopoly stifling competition and keeping mortgage costs high. Harry Chemay concludes our mortgage nation series.
Credit is the lifeblood of modern market-based economies, and the banking system is the beating heart that keeps it flowing. Banks take risks when lending, and their shareholders expect to be appropriately compensated for doing so.
Borrowers are best served when there is robust competition for their loan from a variety of potential providers who deliver services efficiently, honestly and with fairness.
Meanwhile, regulators of various stripes try to balance a range of financial system objectives, from economic stability (RBA) to prudential supervision (APRA) to competition (ACCC) and consumer detriment (AFCA). On occasion, these regulators see risks evolving differently, as they currently do with household indebtedness.
The risk of borrowing
While the latest RBA Financial Stability Review appears sanguine to household financial stress, mortgage debt levels and loan arrears, APRA has instead chosen to retain the mortgage serviceability buffer at 3% despite pressure from some quarters for it to be eased, noting that:
“The level of household debt in Australia is high relative to incomes both compared with its long-term history and relative to international peers, making this a key vulnerability if adverse economic scenarios came to pass.”
The below chart from the RBA, would suggest that APRA’s concerns are valid.
Meanwhile, AFCA, the financial services consumer complaints authority, has seen an 18% rise in complaints involving financial difficulty during 2023-24, noting that about one-third of the more than 5,700 financial difficulty complaints received in that period were in relation to home loans.
Similarly, ASIC, in its role as the consumer finance watchdog, recently released a report finding that the number of hardship notices received by mortgage lenders from struggling borrowers had increased by 54% between late 2022 and 2023.
There appears to be something of a disconnect between Martin Place and the suburbs of Australia, with comparator site Finder recording the highest level of mortgage stress since first tracking it in 2019. Their latest report suggests that
some 42% of the near 60,000 people surveyed in August struggled to pay their home loan.
When it comes to mortgage lending, some three in every four new home loans are written with the Big Four banks. How did Australia come to have such a concentrated banking system?
Australia’s four biggest banks (ANZ, CBA, NAB and Westpac) are the beneficiaries of a ‘four pillars’ policy that stretches back to the 1990s, reflecting a view that these four banks should compete while not being allowed to merge amongst themselves.
With mergers precluded, each has looked elsewhere, resulting in a string of takeovers, mergers and acquisitions of smaller rivals since 1991.
Commonwealth Bank acquired the State Bank of Victoria (1991), the State Bank of New South Wales (as part of a merger with Colonial in 2000), and Bankwest (2008).
Westpac, meanwhile, was no less active, acquiring Challenge Bank (1995), Bank of Melbourne (1997), and NSW-biased St. George Bank (2008).
NAB tried its luck overseas instead, acquiring UK’s Clydesdale Bank and Northern Bank (1987), the Bank of New Zealand (1992) and US-based HomeSide Lending (1997). It has since exited most international operations, returning to focus on the more lucrative Australian market.
ANZ Bank followed NAB’s lead overseas but has focussed more on the Asian region. It has interests in countries including Singapore, Vietnam, Cambodia, Taiwan and Indonesia.
Of mortgage giants and minnows
In apparent acknowledgement of the profitability of domestic banking, ANZ Bank now aims to acquire Queensland-based Suncorp Bank for some $5 billion, removing yet another competitor second-tier bank. Despite the ACCC first denying the proposed merger in late 2022, the Australian Competition Tribunal overturned the ACCC’s decision earlier this year, paving the way for it to proceed.
The proposed ANZ – Suncorp merger provides a glimpse into the concentration of Australia’s $ trillion mortgage market, one heavily shaped by the four pillars policy.
One, however, need not read the ACCC’s final determination on its (now overturned) decision to deny the merger, nor the numerous expert reports, submissions, consultations and other material supporting it to understand the nature of mortgage market concentration in Australia.
Between domestic banks, credit unions, building societies and local branches of foreign banks, Australia has a little over 100 institutions from whom borrowers can seek a residential property loan.
But it’s the Big Four who dominate, together accounting for some 75% of all mortgage debt outstanding, with the CBA at around 26% market share, Westpac at some 22%, NAB at 14% and ANZ at 13%, according to data provided by the banking regulator APRA during the ACCC determination. ANZ’s acquisition of Suncorp Bank would add about 2% to its market share, leapfrogging NAB into third spot.
The next two largest mortgage lenders, Macquarie Bank and ING Bank, hold about 5% and 3% of the market, respectively.
The market share of the Big Four in total assets almost perfectly mirrors their share of the mortgage market, benefitting from home loan growth as shown in the chart below.
Contrast that to the US, where the four biggest banks by total assets are currently JP Morgan Chase, Bank of America, Citibank and Wells Fargo.
When it comes to US mortgage lending, however, only Bank of America makes the top four, with JP Morgan Chase and Wells Fargo not even in the top ten. Instead, the US mortgage market is far less concentrated, with the current largest lender, United Wholesale Mortgage, barely holding a 6% market share.
That the Big Four hold such power within Australia’s financial system, mostly through their dominance of residential property lending, speaks volumes about just how much the economy is shaped by our $11 trillion housing market.
Lack of real competition
In allowing the proposed merger between ANZ Bank and Suncorp Bank to proceed, the Australian Competition Tribunal has made an assessment that there will be no detriment to competition from the union, instead finding a “net public benefit”.
Looking, however, at the material provided by the ACCC in its earlier determination to block the merger, a very different picture emerges, with its final determination noting that it was:
not satisfied in all the circumstances that the proposed acquisition is not likely to substantially lessen competition.
The ACCC had good reason to be wary, with its previous inquiries into the mortgage market in 2018 and 2020 finding a range of advantages for, and behaviours by, the Big Four which allowed them to dominate the mortgage market, including a funding cost advantage, opaque discretionary pricing, structural barriers for new entrants and the potential for what the ACCC terms ‘coordinated conduct’.
The previous inquiries had observed the Big Four exhibiting “signs of oligopolistic behaviour” by engaging in “an accommodative and synchronised approach to pricing”, the ACCC further noting their pricing strategies were often being used “to accommodate, rather than challenge, rivals”.
Suncorp, why?
Overall, the ACCC would have preferred Suncorp Bank to either continue to operate independently or alternatively seek a merger with a fellow second-tier bank.
It looks instead like Suncorp Bank will follow Challenge Bank, Bank of Melbourne, State Bank of New South Wales, St George Bank and Bankwest among other mortgage lenders who have fallen into the fold of the Big Four.
And Australia will continue to be a Mortgage Nation, beholden unto the Big Four banks as they gradually hoover up and negate what little genuine competition remains.
As further evidenced by our supermarkets, airlines and telecommunication providers, market concentration over competition is the Australian way.
This post was originally published on Michael West.
Government spending is keeping Australia out of recession, just, as this week’s feeble GDP numbers tallied 7 consecutive quarters of negative growth. Michael Pascoe reports on the moaning business lobby.
A funny thing happened after Wednesday’s weak national accounts figures: a large part of the economic commentariat poured scorn on government spending and investment for keeping the economy afloat.
If you read the Australian Financial Review, alias the Business Council Bugle, you could be forgiven for thinking what Australia needs now is a good old-fashioned recession. You know, extra hundreds of thousands of people out of work, mortgagee auctions aplenty, small business bankruptcies through the roof.
That’d teach those uppity workers to forget about pay rises and be grateful for a cheap casual shift if they were offered one.
On top of giving plenty of voice to those wanting interest rates higher for longer, the AFR is busy bemoaning governments doing what the private sector is not. That is, investing in the nation.
The neocons remain amongst us,
decrying the simple Keynesian reality of government activity doing the lifting when the private sector does not.
As the ABS national accounts made very clear, it was the public sector that kept Australia’s gross domestic product growing in the September quarter, albeit weakly. GDP rose 0.3 per cent in the quarter to make it 0.8 per cent growth for the 12 months.
Private consumption was flat in the quarter despite pay rises and two months of tax cuts while a rise in housing completions resulted in private investment scraping a 0.1 per cent gain, so effectively flat.
And that’s where the government sector came to the economy’s rescue with a 6.3 per cent increase in public investment after three quarters of falls and a 1.4 per cent increase in government consumption with state and local governments doing most of the spending and investing.
So does government get any praise for preventing the headline GDP joining per-capita GDP in the red? Of course not.
‘Crowding out’ yawn
Instead, the neocon commentators echo shadow Treasurer Angus Taylor in claiming government spending is “crowding out” private sector activity.
Oh please. Outside the resources industry that effectively runs its own race, fast or slow in keeping with commodities cycles, Australian business investment has been lacklustre or worse for more than a decade.
One of the funnier quotes in the AFR GDP coverage came from an anonymous CEO complaining about “rock-bottom productivity growth that makes it hard to get growth without creating inflationary pressures”.
It’s funny because it reflects the usual BCA whinge that somehow the government is responsible for private sector productivity growth. By definition, the average CEO is average. In the Australian corporate zoo, given the collective scorecard, they are very average indeed.
Productivity growth happens or doesn’t happen on every individual shop floor, how it’s managed and led, how the workforce is engaged or not. Neither Treasury or the RBA has a magic productivity wand to wave.
And if you’re naïve enough to swallow the disproven chant that cutting taxes would boost productivity, I have several bridges and a Laffer Curve to sell you.
As it happens, there has been no productivity growth over the past year. As measured by GDP per how worked, it fell 0.5 per cent in the quarter to be down by 0.8 per cent for the 12 months.
But non-mining profits kept motoring along, which might suggest something about how the average business doesn’t feel the need to make the investments required to lift the productivity anyway.
Productivity ain’t profits
Lazy business leaders and their shills routinely conflate productivity and profits. Businesses outsourcing work to cheaper labour aren’t increasing their productivity, only their profits.
And then there’s our supposedly new improved RBA which is increasingly looking decidedly unimproved, keeping rates higher than they should be when faced with a trend of seven quarters in a row now of per-capita recession, hung up on a productivity number which, like “full employment”, they can’t grasp while inflation has fallen back within its mandated target.
Speaking of which, the national accounts’ implicit price deflator for private consumption (the fancy name for the accounts’ price index) came in at 0.7 per cent for the quarter. Multiply by four for a rough annual figure and you get 2.8 per cent – within the RBA’s target range.
For the 12 months, the deflator dropped to 3.6 per cent from 4.4 per cent at the end of the June quarter, further evidence of inflation trending down as it should, further evidence of the RBA looking like becoming the only central bank that demands to have inflation at its target before taking the foot off the economic brake.
An interest rate cut won’t make business more productive, but it would make it easy for business to invest to become more productive, if said business can be bothered to.
A lesson from the free money being handed out during COVID was that small-to-medium businesses, once they had ordered a new ute and a coffee machine, reacted much like Australian individuals by investing in property rather than the business. So it goes.
Damned if you do, damned if you don’t
But, hey, don’t let that stop the usual suspects blaming governments for doing the Keynesian thing to keep the economy growing.
Sure, it’s also dependent on population growth, but it’s still growth. How good it is to be in business in Australia where, if you do nothing, your market keeps growing anyway.
And imagine the howls from the same usual suspects if governments at all levels had stepped back, had kept reducing public investment, had not increased spending, had abruptly slashed population growth.
No, we would not have seen a surge of private investment with the animal spirits rampaging through the jungle. We would be in a recession by all definitions.
Oh well, then the RBA might start trimming interest rates.
Australia’s big banks are some of the most profitable in the world, while Australians are some of the most indebted. Harry Chemay examines the connection.
Australians are not only borrowing more and more, we are increasingly turning our houses into virtual ATMs, extracting equity in support of lifestyles no longer attainable from rising real incomes alone. That’s the ‘wealth effect’ that the Reserve Bank itself acknowledges as material to consumer spending these days.
In the first part of this series, we looked at how Australia’s housing market, now valued at more than $11 trillion, is powered by a mountain of mortgage debt, much of it written by the Big 4 banks: ANZ, CBA, NAB, and Westpac.
We uncovered how the average mortgage balance outstanding now exceeds $400,000, while older mortgaged Australians, those between 55 and 64, still owe their banks more than $230,000 on average.
Why are older homeowners making so little headway in being mortgage-free before retirement?
And what does it mean to approach your retirement years with significant housing debt still owing? That’s the focus of the second piece in this Mortgage Nation series.
The age of first homeownership has been steadily rising over the years. In 2016 the median age of the first homebuyer was 35. It is now nudging 37.
On average, Australians own units for between 7 and 9 years, and freestanding dwellings for broadly between 9 and 11 years. That means that few people retire having owned only one property. Many will have sold and bought at least twice more, generally upgrading in some combination of location, size and price as they go.
Thus, a 37-year-old owner occupier who enters the property market today may need to refinance again aged between 44 and 48, and then possibly again in their mid to late 50s.
All this transactional activity currently totals around $18B each month just for owner-occupied dwellings, around 75% of which is written with the Big 4 banks, often via mortgage brokers. Then there’s the housing finance sought by those who have experienced relationship breakdowns.
Data collated by the Australian Institute of Family Studies shows that the age of divorce has been steadily rising since the 1980s, with the median age of divorce for males being 45.9 and 43 for females in 2021. Many of these individuals finance the purchase of a new property (or refinance an existing one) as they reestablish themselves.
And finally, there are those who look to their homes to help supplement their lifestyles, via home equity redraw facilities. A recent study into equity redraw behaviour found that one in five homeowners in Australia had released equity by increasing their mortgage debt in the decade leading up to the Global Financial Crisis of 2007-09.
The researchers found that the most recent median redraws by borrowers accessing such facilities aged 35 to 44 was $70,000, while for 45 to 54-year-olds, it was $100,000.
This dovetails with prior evidence that between 2000 and 2009,
one in five homeowners aged 45 to 64 years increased their mortgage debt even though they did not move house.
All of which result in two consequential outcomes.
Global debt-to-income ratios.
First, Australians are now among the most indebted people anywhere. The Reserve Bank acknowledges that the ratio of debt-to-income for Australian households is among the highest in the developed world, as this chart from a 2020 RBA research paper indicates.
The most recent figure has the Australian household DTI ratio at some 214%.
That, as mortgaged homeowners have recently experienced, creates a lot of pain when interest rates suddenly rise. The larger the loan taken, the greater the pain.
Second, it’s taking longer to be mortgage-free.
In 1981, the typical age at which home-owning Australians would pay off their mortgage was 52. According to Treasury, by 2016 one in every two Australians aged 62 still had a mortgage balance outstanding. Adding $100,000 to your mortgage in your mid-40s to 50s certainly wouldn’t help matters here.
Where are the Big 4 Banks?
Having been excoriated during the 2018-2019 Hayne Royal Commission, losing all but one CEO, the Big 4 banks have bounced back surprisingly well, doubling down on ‘traditional retail banking’ (i.e. mortgage lending) while near-completely exiting superannuation, wealth management and financial advice.
The recently released Major Australian Banks year-end roundup by consulting firm KPMG shows the Big 4 generating a combined net profit after tax of almost $30 billion, generated from operating income of some $90 billion.
To put that into perspective, the only ASX-listed company that can break the stranglehold of the Big 4 banks for profitability is BHP Group Limited, a dual-listed entity with significant mining and mineral interests around the globe.
By contrast, having reduced their global footprint over the past decade, the Big 4 banks generate most of their revenues within Australia.
With an average return on equity just shy of 11%, they are some of the most profitable banks anywhere in the world’s advanced economies.
A large part of that success is due to the humble residential property mortgage.
What does it mean?
Australia is full of incentives that encourage the building of wealth through residential property, and a financial system primed to facilitate that very outcome.
As house prices are now both comically and economically detached from wages, the only way to continue playing this game (lest you get left behind as a forever renter) is with ever-escalating debt, hoping that your home equity will outgrow the interest you’ll pay on it.
We’ve loaded ourselves up to the eyeballs with mortgage debt to chase financial security and the Australian dream.
Which would be fine, if our real (after-inflation) incomes could even remotely keep up with rising property prices. Instead, income growth has broadly flatlined since the mid-2000s, as the below chart by Bill Mitchell, Professor in Economics at the University of Newcastle, shows. After inflation, growth in private sector wages has been anaemic at best.
Conventional economic theory suggests that large housing debt taken early becomes a minor problem as you age, because your growing real income makes the debt a smaller percentage of your overall living expenses as time passes. In essence, you simply ‘deflate’ the housing debt problem away.
Except that’s not what has eventuated for many who’ve entered the housing market in the last 20 or so years, as the below chart from the Committee for Economic Development of Australia (CEDA) indicates.
Changing circumstances, property upgrades and relationship breakdowns force people back into the housing market at ever higher prices, financed with ever greater mortgage debt. And even when we’re not moving, we spend our ever-increasing mortgages – the wealth effect.
The flip side of this profligacy is that we’ll most likely carry significant mortgage debt into our sixties, and then be faced with hard decisions as retirement approaches. Continue working well beyond 65 to pay off the mortgage from our wages, or dip into our superannuation to be done with the debt noose.
Either way, our Big 4 banks are in a no-lose position.
In the final instalment of Mortgage Nation, we’ll look at how the Big 4 banks have built such an unassailable position in residential property lending, how such lending is financed, how loan books are regulated and whether the rise of mortgage brokers has had any impact on the dominance of the four major banks.
Australia has one of the most concentrated banking systems in the developed world, and we owe more to the ‘Big 4’ banks than ever, including those about to retire. Harry Chemay with the analysis.
A lot has been written about Australia’s falling housing affordability in the last few years. Most of it has focussed on the problem of getting that first foot on the housing ladder and ceasing to be a ‘forever renter’.
Less, however, has been written about what it means to have a mortgage in Australia now and what it might mean as homeowners age.
Turns out it’s a lot easier to get into mortgage debt than it is to pay off. It’s never been easy to be mortgage free, but it’s getting a lot harder. That’s bad for individuals but great for the major banks.
The mortgage market
It’s difficult to find accurate historical snapshots of Australia’s entire mortgage market, but occasionally, its size and characteristics are revealed as part of an official proceeding.
As was the case in the 2018-19 Royal Commission into Misconduct in the Banking, Superannuation and Financial Services Industry (the Hayne Royal Commission). Data gathered there shows that in November 2017, there was a total of $1.07 trillion in finance for owner-occupied housing provided by approved deposit-taking institutions (ADIs) and a further $560B for investment properties.
Housing loans were comfortably the largest asset of ADIs, accounting for some 42% of total assets at the time.
Banks completely dominated the mortgage market, holding a 98% market share,
with the balance held by a smattering of permanent building societies and credit cooperatives.
Spin forward seven years and what does the mortgage market look like now?
The most recent data released by the banking regulator, APRA, shows that the total amount of credit extended for owner-occupied loans by all ADIs sat at some $1.5 trillion in June, up 50% since the Hayne RC. Credit outstanding across all property loan types (including investment and revolving credit lines) totalled $2.26 trillion.
But this isn’t a story about all ADIs. Credit unions and building societies continue to be bit players, with barely any change in market share since 2017. As for the banks, only four really count in the mortgage market.
The ‘major banks’ (as APRA collectively refers to the ANZ Bank, Commonwealth Bank, NAB and Westpac) currently hold around 75% of all property-related loans. These ‘Big 4’ account for over $1.7 trillion of all residential property credit outstanding at present.
Unsurprisingly, that results in Australia having one of the most concentrated banking sectors among advanced nations, as the chart below from a 2017 Reserve Bank paper indicates. (More recent data suggests this has not changed much.)
Source: Reserve Bank of Australia
Owner-occupier debt burden
To understand the mortgage market and its impacts on home-owning borrowers, you first need to understand who is, and who isn’t, an owner-occupier mortgagor.
Using data available from the Australian Institute of Health and Welfare, I estimate that the current number of dwellings in Australia to be approximately 10.5 million (up from 9.8 million at the 2021 Census).
Of these, I estimate that around:
67% (7 million households) are homeowners, of which:
32% (3.4 million households) without a mortgage
35% (3.7 million households) with a mortgage
31% (3.3 million households) are renters:
26% (2.7 million households) rent from private landlords/investors
3% (320,000 households) rent from state or territory housing authorities
2.4% (250,000 households) rent from other landlords
The remaining 220,000 households have other arrangements, including households that are not owners with or without a mortgage or a renter.
It’s the 3.7 million households with an existing mortgage who collectively owe some $1.5 trillion in owner-occupier term loans.
The Hayne RC noted that the average balance of such a loan in September 2017 was $264,000. The current equivalent is just shy of $410,000 – 55% growth in seven years.
The average new owner-occupier loan, according to the Australian Bureau of Statistics (ABS), is now around $640,000 across Australia, a direct result of a nationwide median (middle) dwelling price of some $800,000.
(As an aside, a $640,000 principal & interest owner-occupier mortgage taken for 25 years at the current standard variable interest rate will result in you repaying roughly the same again in interest for a total repayment of around $1.27 million in today’s dollars.)
Clearly not every mortgaged household has a $640,000 or greater loan balance outstanding. Many have been servicing mortgages for years, possibly for two-plus decades. So the older the mortgaged household, all things equal the lower the outstanding balance should be.
And this is indeed the case, as the latest NAB Wellbeing Survey data indicates.
Source: NAB Wellbeing Survey, 3rd Quarter, 2024.
NAB’s current average outstanding balance for the peak mortgage years (30 to 49) just about aligns with my estimate of just over $400,000. But look at the 50 to 64 and the 65+ age groups. These are non-trivial balances remaining.
According to the ABS, the most recent estimated average mortgage outstanding for those aged between 55 and 64 is now north of $230,000,
with 54% of homeowners in this age group still owing their bank for the roof over their head.
How are so many older Australians, who would likely have bought their first homes in the 1990s or 2000s at significantly lower prices, still carrying so much mortgage debt in 2024?
After all, a median Sydney house in 1990 would have cost the equivalent of around $450,000 today (adjusting for inflation), while a similar Melbourne house would have cost some $310,000.
In the year 2000, the median prices in those two cities would have been $540,000 and $360,000, respectively.
In a second article, we’ll uncover just why so many older Australians are still holding large mortgages despite getting into housing at much lower prices.
Although overshadowed by a horse race and a presidential election, Reserve Bank Governor Michele Bullock today should seize her share of the headlines with a single word: Success! Michael Pascoe explains:
This afternoon the battered RBA has a golden opportunity to regain some of the public respect it has lost in recent years. Governor Bullock can point to the facts – not the pet shop’s multitudinous opinions – and humbly celebrate the bank’s monetary policy working as intended, enabling the board to trim the cash rate by 25 points to 4.1 per cent.
Anything else will be a betrayal of the bank’s mandate, confirmation of a reduced institution’s lack of conviction and ticker.
Here are the facts that should be front and centre of the board’s statement at 2.30 this afternoon, numbers that all say the time to trim is now:
The run of the past four ABS annual core inflation counts from its monthly figures: 4.1, 3.8, 3.4, 3.2 – a drop in the core inflation rate of 0.9 percentage points through the September quarter. That is a story of monetary policy working surprisingly well, inflation trending down to within a whisker of the target with a soft labour market landing.
The September quarterly figures highlighting the bigger-than-expected drop in annual core inflation from 4 to 3.5 per cent – meaning the RBA is considerably closer to its inflation target than the world’s other major central banks were when they first trimmed rates, as reported here (https://michaelwest.com.au/wp-content/uploads/2024/10/david-clode-l6XgX-GDnso-unsplash.jpg ) but widely ignored by the pet shop galahs.
For a second opinion, yesterday’s Melbourne Institute’s monthly inflation gauge trimmed mean measure recorded an increase of 0.1 per cent in October, following a 0.1 per cent change in September. “The trimmed mean rose by 0.1 per cent over the three months to October, commensurate with the change observed over the three months to September,” the Institute found. “In the twelve months to October, the trimmed mean increased by 2.7 per cent.”
The biggest housing markets have turned or are turning the corner on price expectations, removing the “wealth effect” spending impetus, and rent increases are trending lower as renter resistance mounts.
The ABS headline CPI landing at 2.8 per cent, within the bank’s target range. Yes, the extra shove to get below 3 did come from some temporary government rebates, but as Peter Martin explained in The Saturday Paper,that extra shove feeds into the future core:
“Low actual inflation, which is what the budget measures on electricity prices and rents delivered, is pushing down future inflation in other ways as well.
“Hundreds of thousands of contracts have escalation clauses linked to the consumer price index. If the CPI goes up more slowly, the price in the contracts goes up more slowly. The alcohol excise is linked to the CPI, as is the petrol excise, student debts, child support payments, family tax benefits and unemployment payments. If the CPI moves more slowly, a vast mass of other prices moves slowly in its wake.”
Another fact the RBA needs to accept is that its modelling is not very good at forecasting. The Governor’s tough talk about not cutting rates this year was based on predictions that were simply wrong – and not by a small margin.
Wrong assumptions
The RBA didn’t expect the headline CPI to fall below 3 per cent before the end of the year. Wrong.
The RBA didn’t expect its favoured core inflation measure to hit 3.5 per cent until December. Wrong.
The facts, both the present numbers and the bank’s forecasting errors, mean the Governor’s rhetoric is now out of date.
The quote commonly attributed to John Maynard Keynes applies:
“When the facts change, I change my mind. What do you do, sir?”
The commentariat’s consensus and the money market’s bet that the RBA will sit pat today is based on Michele Bullock’s mistaken rhetoric.
The economists forever asked their opinion tend to be answering the question “What do you think the RBA will do?” rather than “What do you think the RBA should do?”
Not untypical is the former RBA chief economist Luci Ellis, now in charge of Westpac’s economics team, quoted in The Saturday Paper article as expecting “a change of language” after today’s board meeting, saying Governor Bullock “will soon have to acknowledge we are getting closer to the point when rates will start falling”.
What the? This is the facile stuff of expecting the bank to prioritise saving face in light of a dud forecasts and inappropriate jaw-boning.
“Gee, fellas, we’ve been wrong and should trim rates today, but let’s not admit it. Instead, we’ll slide towards the right decision pretending we haven’t made any mistakes.”
That would be appalling weak leadership. The present Governor, Deputy Governor and chief economist have never been in the position before of having to make the call to change monetary policy direction, of pulling the trigger. A degree of timidity after so much effort to convince people it wouldn’t be safe to trim rates is understandable, but not excusable.
Inflation clearly falling
To again reference Peter Martin’s pay-walled story, he quotes previous RBA Governor Bernie Fraser as regarding Governor Bullock’s semi-commitment to leaving the cash rate at the highest level in more than a decade as reckless when inflation is clearly on the way down.
“It is not good policy-making and it is not in accord with what the bank’s job is,” Fraser told The Saturday Paper. “The job of the bank is to weigh up these things and make judgements about what is appropriate now in the light of what they can see ahead without getting locked into forecasting particular times when interest rates will move.”
Fraser said the job of the bank was to ease off on interest rates early, in the same way as the job of a driver was to apply the brakes before the car hits something.
And the good news for the RBA after these harsh words is that the change in policy is the opportunity to celebrate the job that has been done, to claim success in walking “the narrow path” of bringing down inflation while not damaging the labour market.
But what matters more for this RBA board, face or facts?
After her rhetoric about not cutting interest rates this year, RBA Governor Michele Bullock will have her credibility on the line if she doesn’t cut on Tuesday. Michael Pascoe reports the RBA’s hawkishness is suddenly looking very lonely.
Wednesday’s inflation figure – never mind the 2.8 % CPI, the trimmed mean rose 0.8 % in the September quarter to make 3.5 for the year – has dramatically changed the outlook for interest rate cuts. Yes, the Reserve Bank needs to cut and cut now.
Yet the RBA leadership – lacking experience in taking the big step of changing policy direction – will have its nerve, pride and courage tested next week in coming to terms with the change.
The bank will have to overcome its months of persistent handwringing about “sticky” inflation, its prioritisation of talking tough and carrying a big stick to maintain “anchored” market expectations of low inflation. In short, Michele Bullock is in danger of doing a Phil Lowe in reverse – being trapped by past statements when circumstances change.
Of course there are the usual pet shop galahs screeching that core inflation is still too high (3.5%! The sky is falling!) and that rates must not be cut. There will even be the odd one or two wanting an increase.
But that’s not how the professionals who actual deal with monetary policy see it. It’s not how just about every other major central bank operates.
Safety in numbers
A thing about central bankers is that they tend to like safety in numbers, they feel uneasy if they find themselves at odds with their peers for long. We’ve even had the Treasury’s inquiry designed to make our RBA more like the others.
“The others” – the US Federal Reserve, the European Central Bank, the Bank of England, the Bank of Canada, even the RBNZ – have already been where the RBA is now.
All of them started cutting rates well before inflation had reached their targets.
All of them understood the lagged nature of monetary policy.
All of them wanted to avoid causing a recession.
In fact, they all changed direction and started easing rates when their inflation was much further above their targets than where the RBA’s is now.
An economist friend, former Reserve Banker Frank Campbell, has done the research to compare the trigger moments for central bank easing and has shared his homework.
Assuming the RBA has the courage to do the right thing on Tuesday and does not feel trapped by Michele Bullocks’ forward guidance that she says isn’t forward guidance, it will trim its cash rate by 25 points to 4.1 per cent when its measure of core inflation is 0.5 above the top of its two-to-three per cent target range.
The preemptive strikes
When the US Fed (in September), the ECB and the Bank of Canada (both June) first cut rates, they all had inflation 0.7 above their targets.
When the Bank of England first cut in August, inflation was 1.5 above target. The RBNZ, also August, was a whopping 1.6 above.
Not only that, all of those central banks were further away from their forecast date of inflation hitting target than the RBA is now. When they cut, the Fed, ECB, BoE and RBNZ weren’t expecting to hit target until 2026.
The RBA’s August set of forecasts predicted hitting the top of the core inflation range in the second half of next year.
Hawks, doves, penguins and a shag
The monetary aviary keeps expanding beyond hawks tightening, doves loosening and emperor penguins sitting pat. Rather than being seen as a monetary hawk if it doesn’t cut rates on Tuesday, the RBA will appear as a lonely shag on its monetary rock.
Worse than appearances, the RBA will be in danger of causing more serious damage to the Australian economy and those who sail in it, especially those bailing hard to keep their heads above water.
Treasury’s RBA Inquiry recommended the bank communicate more, resulting in an investment in more PR staff. A Chief Communications Officer now sits in on board meetings.
For those with a career in spinning, tailoring the necessary change of policy on Tuesday also might be a challenge. It would be a gormless PR play to hold off biting the bullet until December for the sake of being seen to phase in the change. Delaying to see the September quarter GDP number on December 4 would be a meaningless fudge.
They will say …
The wannabe hawks might argue that being 0.5 above the top of the target range isn’t enough. The new agreement with the Treasurer oddly added “the midpoint of the range” – 2.5 % – as something the bank should tend towards, but the actual target remains the range, not the midpoint, as December’s Statement of Monetary Policymakes explicit:
The Reserve Bank Board and the Government agree that a flexible inflation target is the appropriate framework for achieving price stability, recognising the importance of low and stable inflation. They agree that an appropriate goal is consumer price inflation between 2 and 3 per cent. This approach supports the anchoring of inflation expectations, while recognising that all outcomes within the target range are consistent with the Reserve Bank Board’s price stability objective. The Reserve Bank Board sets monetary policy such that inflation is expected to return to the midpoint of the target. The appropriate timeframe for this depends on economic circumstances and should, where necessary, balance the price stability and full employment objectives of monetary policy.
Which brings up the mystery of “full employment” – the new regime’s euphemism for the old NAIRU (non-accelerating inflation rate of unemployment).
Forget the euphemism. The RBA has never known what the NAIRU is until it sailed past it. It’s a figure only seen in the rear vision mirror.
The story of recent years is one of the econocrats being consistently wrong about the NAIRU and having to steadily reduce their guess as unemployment fell. Most recently, the RBA has reckoned 4.4 per cent – but it simply does not know.
Labour market strong
Yes, the labour market is strong, employment growth is strong – and they are good things that are not pushing up inflation. Unemployment is steady at 4.1 per cent with inflation heading in the right direction. This should all be seen as positive news.
Economist and former Gillard government adviser Stephen Koukoulas argues that something is not computing about our labour market. It is a contradiction to have good employment growth and such weak economic growth.
“Which is accurate?” he asks. “The measures and estimates of GDP or the labour force with employment and unemployment?
“The simple answer is both could be correct — or that we don’t yet know.
“Australia has also seen the boom in job creation coincide with clear signs of moderating wage growth – again, something that rarely if ever happens in any sustained way.
“And this with a government-inspired lift in wages in a few essential services – as well as chunky increases in minimum wage awards by the Fair Work Commission (FWC) – rather than a strict demand driving wages surge.
“Wages growth would be materially lower without these interventions.”
The RBA is only fooling itself if it pretends to know what NAIRU is even while pushing to take unemployment higher. A paragraph in an earlier Statement on Monetary Policy this year admitted it could start with a 3 – a possibility not a probability, according to the RBA.
Inflation is trending down
What the bank’s board should know is that inflation is trending down, is on track to hit the target and monetary policy works with a long lag – the tightening flowing through from the last rate increase still isn’t complete.
What the bank’s board should know is that inflation is trending down, is on track to hit the target and monetary policy works with a long lag – the tightening flowing through from the last rate increase still isn’t complete.
The quarterly CPI numbers carry the most weight, but the story of the last three ABS monthly inflation counts show the year-to trimmed mean trending down from 3.8 to 3.4 to 3.2 per cent.
Yes, the services inflation component is sticky, but it’s been sticky everywhere and “services inflation” isn’t what the bank is mandated to massage – it’s the overall number. Besides, interest rates have little impact on the key elements of service inflation – rents, insurance and medical expenses.
The RBA shouldn’t want to be caught out like a shag on a rock. Do it, cut the cash rate. And don’t worry about the facile matter of being accused of misleading the market in the lead up.
This post was originally published on Michael West.
This week marked an historic occasion in the decline of American imperialism, the BRICS Summit in Kazan, Russia, where 13 new states signed up. Many more are queuing. The world is realigning. But you won’t hear much about it in the media. Michael West and Kim Wingerei with the story.
In the Australian media there was barely a mention of BRICS. Similar deal in the UK. This despite the previously unthinkable occurring: the BRICS countries surpassing the economies of the G7 in size, the leaders of India and China sitting at the same table, enemies Armenia and Azerbaijan holding peaceful negotiations on the sidelines, UN Secretary-General Antonio Guterres turning up, Iran and Saudi Arabia as well.
It is reasonable to conclude that the US, in its hopeless efforts to curb Israel’s barbarity in Gaza, the West Bank and Lebanon, may have sped up the rush of nations on every continent to BRICS. Every continent bar Australia. Yet the rise of China and other developing economies are remaking a multi-polar world, amid the decline of American dominance. And the dollar is at stake.
36 world leaders at BRICS Summit
Meanwhile, this momentous event was all but ignored in the pages of the Australian media save a story about Russian president Vladimir Putin trying (unsuccessfully) to use the event to push his Ukrainian agenda.
The BRICS Summit was far more newsworthy in fact. “Maduro won the elections fair,” said Putin of Venezuela’s president, anathema to the US rhetoric. There was much talk of trade and peace and self-determination, and of energy security and critical minerals too. Palestinian President Mahmoud Abbas was welcomed in a meeting with Putin.
As CHOGM kicked off, the global influence of the UK was, as one observer put it, ‘vaporising’. Is Australia moving in the right direction? Are we on the right team? Should we be more independent in foreign policy?
We have been, with little public consensus, sucked into the $368B AUKUS alliance with the UK and the US, both of whom are financing and providing military support to Israel which is on trial for plausible genocide at the ICJ.
The BRICS represent 35% of the world GDP, bigger than the G7 with 30%.
BRICS member states represent 45% of the world’s population, while the G7 only accounts for 10%. Yet G7 meetings (United States, Germany, Canada, France, Great Britain, Italy and Japan) are always widely reported in Australia’s press.
Despite lowered growth forecasts for 2024, BRICS nations still average 3.6% growth, compared to 1% for the G7.
New BRICS partner states
Big BRICS
BRICS stands for the alliance of Brazil, Russia, India, China, and now South Africa, with Egypt, Ethiopia, Iran, Saudi Arabia, and the UAE being invited to join as full members. Turkey – bridging the divide between Asia and Europe – plus Greece and Sri Lanka and many others also saying they want to join.
There is no gibberish about a vague Global Rules-Based Order which is the vague pretext for Australia’s support for American militarism.
List of 41 countries which have officially applied for #BRICS membership and have expressed interest in joining.
What did they talk about? They talked about energy security and cooperation in mineral extraction. Trade and enhancing financial ties too; sanctions, tariffs and export restrictions. They talked about politics and condemned the US Israel genocide of the Palestinians and the invasion of Lebanon.
And perhaps the most worrying thing for the US is the threat to the dollar if the BRICS nations begin trading in their own currencies.
Putin tried on his spiel about Ukraine but was shut down by Xi Jinping. But as for the two-year long claim by US leaders that Putin was isolated, that has been shattered.
The US reaction to the summit was subdued. “We’re not looking at BRICS evolving into some kind of geopolitical rival. That’s not how we look at it … to the US or anyone else,” White House Press Secretary Karine Jean-Pierre told a press briefing.
Putin flashed around a BRICS note – with a smile
Yet as the price of gold hit record highs, news emerged that 159 out of 193 countries have signed up to use a new BRICS settlement system. This would prevent the US and the European Union from deploying economic sanctions as a weapon. This system would see countries settle trades and payments in their own currencies, reducing reliance on the US dollar, which has long been the dominant global currency.
The US has $35 trillion in debt – a debt it can never repay, a debt it owes to the rest of the world which has invested in the world’s biggest market, the US bond market (debt). A large swathe of it is held by the BRICS, who have invested their surpluses.
The adage, she who owns the debt controls the company, means that this is the biggest risk the US faces. Should those bondholders start to sell US bonds en masse, the value of the bonds would fall, and the interest rates would rise. That means inflation. It means making America a very expensive place to live because US importers would have to pay higher prices for foreign goods.
The US dollar remains the world’s ‘reserve currency’ and the settlement method of choice for world trade. But it must now be seriously under threat.
De-dollarization is happening everywhere – from Asia to Africa and Latin America.
The “exorbitant privilege” of dollar is coming to an end.
The question is how will the US react; will it allow a peaceful transition to a multipolar world, or go to war with China – dragging Australia along for the ride – to protect its dollar hegemony?
What about Australia?
Tethered as we are to the US – especially when it comes to our military security – Australia risks being left as the proverbial shag on an old rock.
BRICS talks of energy security and cooperation in mineral extraction could leave our precious resources stranded far away from the centre of the new powers.
King Charles has left the country after many handshakes and even some non-royal hugs with some royal fans while opening up old wounds of colonial times.
He remains the titular head of the British Commonwealth and travelled to Samoa at CHOGM this week. South Africa’s Cyril Ramaphosa and India’s Narendra Modi decided to go to the BRICS summit in Kazan instead. India’s GDP surpassed the UK’s in 2022.
Sri Lanka, which is applying to join BRICS this week, sent neither its prime minister nor its foreign minister. Nor did Canada, a close ally of the UK and fellow member of the powerful “Five Eyes” intelligence-sharing network. The head of its delegation will be Ottawa’s high commissioner to the UK.
UK PM Keir Starmer did get to Samoa but his first visit to Britain’s former colonies in the southern hemisphere has been cut short. A UK government official confirmed the PM had scrapped plans to add in a stop in Australia, as aides feared it would keep him abroad for too long ahead of a pivotal government spending package being unveiled in London next week.
Australia has ignored the BRICS Summit but cold geopolitical reality would suggest a major rethink is needed when it comes to foreign policy. If the meeting in Russia showed anything it is that fewer countries than ever are on the same global policy page as the US, yet Australia has just shackled itself tighter than ever, via AUKUS, to the rapidly aging ‘global rules based order’.
Looking at the recent output from think tanks such as Australian Strategic Policy Institute (ASPI), Australia’s defence establishment, as well as our media and politicians appear to been caught on the hop.
This post was originally published on Michael West.
The much-promoted affordable housing centrepiece of the Minns Government’s density push has failed before it starts. A reality check is coming for the NSW Government. Michael Pascoe reports.
It’s a busy time for politicians trying to do something about housing affordability – or at least to be seen to be trying to do something. While Federal Labor is battling the opportunistic Greens-LNP coalition in the Senate over Help-to-Buy and build-to-rent schemes, the actual Coalition is sponsoring yet another Senate inquiry destined to achieve as much as all the other parliamentary housing inquiries – nada.
One of the first actions of the NSW Labor Government upon election 17 months ago was to announce it was scrapping the Greater Cities Commission (GCC), the independent body that attempted to instill some quality in urban planning. The big developers’ lobby, Urban Taskforce, wanted the GCC killed, so killed it was.
The developer lobby and its shills have long run the furphy that the housing crisis was all the fault of pernickety planners and councils, that all would be rosy in the shelter business if governments and councils just got out of the way and let the market rip.
Never mind that our crisis was created by letting the market rip with landlord-centric tax policies and governments deserting social housing and direct development responsibilities.
A bit of a TODdle
With developers having the government’s ear, the grand Minns plan for solving Sydney’s critical unaffordability is indeed to let the market rip with blanket planning permission for higher high rise around transport hubs – the quaintly named TOD (transport-oriented development) program.
Allowing greater density around existing infrastructure, encouraging it even, makes sense – if it is done well and not left to developers’ discretion.
Given the already inflated cost of land and developers’ primary interest in building expensive housing, the sweetener for any remaining Labor faithful was the promise that the higher density hubs would include “up to” 15 per cent “affordable housing.”
Anyone who has ever entered a dodgy shop advertising “up to 50 per cent off!” knows what tends to happen next.
And so it has been demonstrated before a single TOD has toddled into being. Behind the Sydney Morning Herald’s paywall over the weekend, Andrew Taylor blew the whistle ($) on the government’s triumph of spin over substance.
“Planning Department data shows as little as 3 per cent of new dwellings in Bankstown, in the city’s south-west, and Kellyville and Bella Vista, in the north-west, must be affordable housing,” the SMH reported.
“Homebush and Hornsby (both 5 per cent), Crows Nest (10 per cent) and Macquarie Park (10 per cent) will also have significantly less affordable housing under the lower end of the range proposed by the government.”
Why? Simple – the developers complained that 15 per cent targets were too high, leaving many sites unfeasible. There’s a good chance even the 10 per cent targets will end up being watered down.
This is no surprise for the professionals not in the pay of developers or the NSW government. Mobs such as the Urban Design Association saw the Law of Unintended Consequences working hard on the developers/Minns’ plan from the start.
The ‘up to 15 per cent’ claim was merely the usual fig leaf spin to try to overcome some of the NIMBY backlash.
And this is only the rather vague “affordable” housing, not the much harder topic of public housing that governments around the country have been walking away from over the past three decades and more.
The spin attraction of “affordable housing for essential workers” was demonstrated by Premier Minns’ announcement of a $450 million build-to-rent workers on the Sunday before the state budget.
The Premier’s PR people trotted out some paramedics for the media to advertise the 400 homes that would be rented at a discount to the likes of teachers, nurses and firefighters.
Hey, everybody loves the ambos and fireys and nurses and teachers, those brave and generous essential workers – so let’s overlook the fact that 400 homes over three years is a pinch of salt in the Pacific Ocean.
What the spin and photo-op overlooked – and hoped everyone else did, too – is that bus drivers are also essential workers. So are the people who deliver food to supermarkets and stack the shelves. And the carers in aged and childcare centres. And the people who take away our garbage and keep our streets clean. And the road maintenance folk working through the night to fix (and sometimes create) transport mayhem.
In fact, beyond the entertainment, sports and marketing industries, just about everyone is an “essential worker” if our society is to continue to function. And even the jugglers, clowns, singers, footy players and advertising types are necessary for the sort of city and country we want to live in.
Thus, the token “affordable housing” sweetener for a select few of the more marketable occupations is a crock. It’s a distraction. It’s bullshit.
The reality remains that, the housing horse having bolted, only much braver, direct government development has a hope of denting the monster “the market” and neoliberal policies created.
But that would be hard – and the development lobby doesn’t want it.
The Government is ducking and weaving when it comes to banning gambling ads, being pressured not just by the gambling industry but by the perennial whingers from mainstream media. Marketing expert Andrew Hughes offers a dose of reality.
If anything is a sure bet right now, it’s corporate Australia’s willingness to use some variation of the “for society’s good” argument. The most recent example of this is the claim being made, including by federal minister Bill Shorten, that an outright ban on gambling advertising would be disastrous for free-to-air TV.
To be clear, Labor still supports new restrictions on gambling advertisements, including hourly caps and bans during kids’ TV and during and around sports broadcasts. But it has rejected the idea of a total ban, prompting a backlash extending as far as some of its own backbench MPs.
Speaking on ABC’s Q&A on Monday night, Shorten said Australia’s free-to-air TV broadcasters were in “diabolical trouble”, with many needing gambling ad revenue “in order just to stay afloat”.
“I’m not convinced that complete prohibition works,” he said.
So would our commercial TV networks really fall over tomorrow without gambling ad revenue? Or is something else at play?
Let’s start by building a bigger picture of where advertising spend more broadly comes from in Australia. Global analytics firm Nielsen regularly compiles top 20 lists of both the categories and individual companies spending the most on ads here.
In 2023 the top category, retail, accounted for A$2.56 billion in advertising spend. Gambling and gaming, in contrast, represented just $239 million, less than a tenth of this figure.
Harvey Norman topped the list of individual companies in 2023. The first we see of any gambling brand is Sportsbet, which came in at 16th.
For gambling companies, it’s fair to assume the lion’s share of this goes to TV. Research by the Australian Communications and Media Authority (ACMA) found 68% of gambling companies’ ad spend went to free-to-air TV markets.
As for the remainder, 9% went to radio, 15% to social media and 8% to other online platforms.
How much is actually getting spent?
But how do we estimate the gambling industry’s total annual advertising spend? There are certainly a lot of numbers getting thrown around.
More recently, ACMA published detailed figures for the period between May 2022 and April 2023, which put it at just over $238 million, with $162 million of this going to free-to-air TV networks.
But the way advertising is classified – what defines an advertisement – can sometimes differ between agencies. Then there is the number of brands operating, which is constantly changing. In a market with so many competitors, any new entrant needs to spend big on advertising just to capture enough market share to be viable.
This is why I argue that the actual figure for financial year 2023 may be slightly higher than ACMA’s widely quoted figure, accounting for the big ad spend of new entrants that may have fallen outside the time window assessed.
Based on average company ad spend as a percentage of revenue and the size of the gambling industry, I estimate it could be higher, in the ballpark of $275 million.
How much is that to the networks?
This exercise is all about putting these figures in context. Channel Seven, for example, brought in $1.5 billion in revenue in 2023. Even if it had received the gambling industry’s entire ad spend at my higher estimate of $275 million, this would still only account for less than 20% of its annual turnover.
If that money all went to TV ads, Channel Seven’s stated 38.5% share of television advertising revenue would put its revenue from the estimated sports betting advertising at about $106 million in this example, around 7% of its total annual revenue.
Losing most of that would hurt, but wouldn’t mortally threaten the business. Besides, a total ban would most likely be phased in over a number of years, not enacted overnight.
Australia’s free-to-air networks would adapt, re-strategise, and find and develop new markets to replace that revenue. Their management teams are far too smart to just shrug their shoulders and take a revenue hit on the corporate chin.
Networks have had plenty of time to adapt
Just a refresher. LinkedIn is now more than 20 years old. Facebook is 20. YouTube is 19. X (formerly known as Twitter) is 18. TikTok is seven.
If free-to-air TV’s business model is so glacial it can’t function in the digital age, it probably doesn’t deserve to be operating in the big leagues.
Digital is here and has been for a while now. The media industry has borne the brunt of this change, but has also had the most time to adapt to the disruptors, who are now more established oligopolies and duopolies than “cool start-ups” out of Silicon Valley.
The argument that we need to protect sports gambling ads to protect the big media brands – has little to no basis. It’s a worn out argument we’ve seen time and time again – big tobacco, I’m looking at you.
Protecting the interests of corporate Australia at the cost of society itself is a gamble none of us should be prepared to take.
Reserve Bank Governor Michele Bullock last week set out to kill expectations of an interest rate cut. She succeeded, but that doesn’t mean a cut isn’t coming. Michael Pascoe reports.
Here’s the thing about Reserve Bank interest rate guidance: the RBA will downplay the chance of an interest rate cut right up to the minute it cuts them – and even then, it will warn it might put them up again.
RBA Governor Michele Bullock last week achieved her goal of scaring the horses about a possible interest rate rise. The commentariat (almost) universally swallowed it, and according to the Westpac/Melbourne Institute consumer sentiment survey, the public did, too.
“There is a sharp decline in the sentiment reading after the RBA’s decision, down from 89.0 pre-release to 82.0 post-release,” Westpac said. “The RBA’s emphasis on maintaining restrictive monetary conditions to bring inflation towards the target range, or the absence of any guidance on easing conditions, might have been a factor behind the sharp decline in consumer sentiment post-release.”
And that sort of thinking isn’t doing the Albanese Government any favours.
The reality is that the RBA board considered lifting rates last week the same way I consider what I will do winning PowerBall. You can consider it, but it’s not going to happen.
And as for the Governor’s “I’m not giving forward guidance, but here’s some forward guidance” performance, ruling out a rate cut in the next six months, that was nonsense, too.
If the data keep heading in the direction they’re heading, a rate cut will not be off the table at the meeting in six weeks’ time and by the November meeting it will certainly be “live”.
The inflation hawks calling for higher rates are looking backwards, the doves are looking forwards. Given the very lagged nature of monetary policy, the bets need to be made on the future.
Ms Bullock was merely doing what RBA governors do aside from moving interest rates: jawboning the market. The bank didn’t want the market pre-empting its eventual move, so it gave the distinct impression there isn’t one in the offing.
This is the reverse of what Philip Lowe was pilloried for – increasing rates after he gave the distinct impression there was no increase anywhere on the horizon. The media and public will be more forgiving of a change of mind about a rate cut than a rate rise.
The governor kept her outlook simple to achieve her purpose. There was more subtlety tucked away in the quarterly Statement on Monetary Policy (SMP) for those who cared to look for it.
For a start, there was further confirmation that the last rate rise, nine months ago, still hasn’t fully worked its way through the system. The RBA guesses the poor devils taking most of the pain for the team – the average household with a mortgage – will feel more pain by the end of the year if rates don’t move. Required mortgage servicing will take another 15 points of all households’ disposable income by the end of the year – and remember, only about a third of us have a mortgage.
So tell the hawks demanding tighter monetary policy that it’s still tightening.
And then there’s the little matter of the bank already having achieved the old NAIRU (the Non-Accelerating Inflation Rate of Unemployment), not that the RBA wants to talk about NAIRU anymore – it’s too embarrassing and apparently doesn’t mean anything now.
The bank has never known what the NAIRU was at the time – it was a somewhat mythical thing only recognised in retrospect. Previous guesses kept being proven wrong as the unemployment rate came down without accelerating inflation.
Inflation pressures easing
The bank admits the present unemployment rate of 4.1 per cent isn’t “accelerating inflation”. It doesn’t take much of a look at the details of the CPI to see wages aren’t driving the key inflation problem areas.
What the bank wants (but doesn’t spell out) is that it wants an IDRU – an Inflation-Decelerating Rate of Unemployment. It now talks of “full employment” – a euphemism – alleging that the labour market must be too tight because, well, inflation isn’t coming down fast enough. You know, more demand than supply sorta stuff.
The RBA deputy governor, Andrew Hauser, delivered a rather candid speech on Monday, admitting how poor the RBA and everyone else is at forecasting and how the bank tries to learn from its mistakes. (The revisions from the May SMP to the latest edition illustrate the RBA understandably isn’t too sure of what’s actually happening now, let alone in several months’ time.)
Looking for a reason for inflation being “stickier” than it had forecast, the bank has come up with the theory that supply is weaker than it realised. Admitted Mr Hauser:
“Now, it is one thing to hypothesise weaker supply, it is another to quantify it. And that’s because supply is not directly observable: it is a classic latent variable. So any estimate is subject to huge uncertainty.”
So the economists crank out all the models they can think of to make various guesses for them and figure that, hey, somewhere in the range must be the answer. Specifically in regards to the labour market, the banks’ modellers came up with Graph 7, showing the range of space capacity estimates.
That range looks like the bank’s models want somewhere between zero-point-fraction and one-point-fraction per cent higher unemployment – say, 4.3 to 5.3 per cent – to balance supply with demand. What a happy thought.
Mr Hauser himself doesn’t sound too convinced by the exercise, however:
“It must be said, however, that these changes in assumptions are tiny relative to the huge true range of uncertainty over these measures. So we have to be humble about our confidence in this judgement: spare capacity could easily be much higher or much lower.”
To put it more succinctly, they simply don’t know. Despite that, the bank’s forecasts show the board is shooting for a 4.4 per cent unemployment rate as the answer. Thus it is RBA policy to persecute several thousand more of the innocent who have no role in keeping inflation higher than desired.
Wages growth abating, too
Meanwhile, Tuesday’s wage price index printed with a June quarter rise of 0.8 per cent following a March quarter rise of 0.9 per cent i.e. an annualised rate of 3.4 per cent over the first half of this year and while the CPI on the same basis was 4 per cent.
Don’t blame wages growth for inflation. Not only have we achieved NAIRU, we might well have IDRU.
Looking ahead to the annual figure, the high 2023 September quarter WPI rise of 1.3 per cent will drop out. That figure included a 5.75 per cent Fair Work Commission increase in award wages – this quarter, the increase is just 3.75.
So why was Governor Bullock and Co jawboning so hard? Partly to get as much mileage as possible out of the present restrictive rate, partly because of what was spelt out in the SMP’s “Box A: Are Inflation Expectations Anchored?”
The bank is, therefore, quite chuffed to show the money market, and the consensus of market economists to believe not only that it is fiercely determined to get inflation down to 2.5 per cent but also that it will actually achieve that ambition.
The latest SMP stated:
“Inflation expectations are the rates of inflation that people expect over some future horizon. These matter because actual inflation partly depends on what people expect it to be and build into their wage- and price-setting behaviour. We consider inflation expectations to be ‘anchored’ if they are stable at a level that is consistent with inflation being maintained at the midpoint of the target band (2½ per cent) over an appropriate period.”
The expectations are presently anchored, so keep ‘em believing, talk tough, hose down any signs of pre-emptive softness on rates and the job is half done.
And if there’s a little misleading going on…well, that’s part of the job.
PS> Also missed by nearly everyone, the RBA has downgraded its expectations for dwelling investment both this financial year and next. Not to put too fine a point on it, the RBA reckons Albanese’s “one million new homes in five years” is shot, let alone that fairytale 1.2 million “stretch target”.
As expected, the RBA kept the base interest rate unchanged at 4.35% today. But while interest rate chatter gets the headlines, Australia’s biggest economic and social disaster remains the worsening housing crisis. Michael Pascoe on the RBA calling bullshit on the Government’s housing rhetoric.
The RBA on Tuesday gave the Federal Government reason to hope for an interest rate cut or two before the May election. That dominates the usual headlines and immediate politics.
But tucked away in the bank’s Statement on Monetary Policy (SMP) was a ticking social and economic bomb: our housing crisis is only going to worsen for as far as anything like a credible forecast can. Anthony Albanese’s housing accord target is a joke one month into its five-year time frame.
In the fine print of the SMP, the RBA downgraded its best guess of housing investment over the next two financial years, in the process amplifying its forecasters’ biggest disagreement with Jim Chalmers’ Budget hopes.
The standout disagreement between the Treasury and the RBA in the budget forecasts was what’s supposed to happen with dwelling investment next financial year.
The bank and government more-or-less agreed dwelling investment would remain flat this year, but for 2025-26, Jim Chalmers was seeing rainbows, lollipops and very busy brickies.
Chalmers forecast dwelling investment would suddenly soar by 6.25 per cent. It would need to if there’s to be any hope of meeting Albanese’s brave “one million new homes in five years” pledge, let alone his crazy-brave 1.2 million stretch target.
The week before the budget, the RBA thought dwelling investment this financial year would increase by just 0.2 per cent (i.e. bugger all) and by just 1.8 per cent in 2025-26 (i.e. only a bit more than bugger all).
Now though, the RBA reckons dwelling investment will fall by 0.7 per cent this year (less than bugger all) and increase by only 1.1 per cent next year (closer to bugger all). The one million target is shot.
Just 163,000 housing applications were approved in 2023-24. The dwelling investment forecast is about money, not dwelling numbers, so the same sort of money invested over the first two years of the accord will mean fewer housing starts than last year,
nowhere near the 200,000 needed each year for five years to meet the promise.
If our preeminent independent forecaster is correct (as opposed to Jim Chalmers trying to head off Green inroads built on housing), rents will keep rising, homelessness will keep growing, affordability will keep worsening, and the biggest single cause of our “cost-of-living” pain will remain.
In short, “we’re going to need a bigger boat”. The housing monster eating people won’t be tamed by present policy. Given population growth, we will continue to go backwards.
Ahead of the budget, the National Housing Supply and Affordability Council – the government’s new, independent expert housing intelligence source – forecast that over the accord’s five years, there would be gross new supply of 903,056, but net new supply of only 869,126 while new demand for dwellings would be 1,079,302. Thus way short of the politicians’ promise and 1,897 dwellings worse off than we are now.
If the bank was more than a waver of the big interest rate stick, it would be making a case for radical government investment in housing. But in fact, it’s nothing more than a waver of the interest rate stick.
As for the alternative, forget it. The Coalition’s announced housing policy makes Labor’s efforts look brilliant. It is simply too dreadful to contemplate.
Inflation figures are out, showing the CPI is 3.8% for the June quarter, up by 0.2% which does not bode well for interest rates, but is this really a good measure of the cost of living? Harry Chemay.
The post-lockdown resurgence of the Australian economy between 2021 and 2023 brought with it a confluence of inflation-inducing effects. But inflation cuts different ways for different groups of people. Wage-earners in particular, are much worse off than what the CPI suggests.
Consumer inflation, as measure by the Consumer Price Index (CPI), started to trend up in early 2021, rose past the Reserve Bank’s (RBA) target band of 2% – 3% p.a. by mid-year, and would go on to register an astonishing 7.8% for calendar year 2022.
The RBA responded to the inflationary threat by lifting interest rates 13 times between May 2022 and November 2023, resulting in the current cash rate of 4.35%.
If CPI is used as a measure of inflation policy success, this intervention appears to have worked, with the latest CPI coming in at 3.6% year-on-year for the March 2024 quarter, almost back within the RBA’s target band, as the chart below indicates.
But maybe the CPI isn’t the most appropriate measure of how Australians actually experience cost-of-living pressures, given their actual consumption patterns.
CPI – a blunt measure
The CPI has been measured by the Australian Bureau of Statistics (ABS) using the same basic methodology back to at least 1960.
It aims to measure changes in the price of a fixed quantity (basket) of goods and services acquired by consumers in metropolitan private households (what the ABS terms ‘the CPI population group’).
Prices are tracked across thousands of items that are aggregated into one of 11 groups, these being:
The weightings in the CPI basket above are meant to represent the consumption pattern of the ‘typical’ Australian household.
However, it’s a big ask for one basket of goods and services to accurately reflect the consumption preferences of disparate households that may differ by geography, age, income and, importantly for retirees, connection to work (sources of income).
In truth, the CPI is not a measure of the changing purchasing power of households with differing consumption patterns. The ABS itself concedes the point, noting that :
“At the end of the day, the CPI is most useful as an indicator of price movements, whether it be for specific items, a particular city, or the economy as a whole. The CPI is not a precise measure of individual household price experiences.”
Thankfully, the ABS has other inflation gauges that are better at assessing cost-of-living changes across differing household types.
Selected Living Cost Indices
To overcome the known limitations of the CPI in measuring household purchasing power, the ABS progressively introduced a series of Living Cost Indexes from 2000 onwards.
Whereas the CPI measures the change in the price of a fixed basket of goods and services, these cost-of-living indexes measure the change in the minimum expenditure needed to maintain a certain standard of living.
The ABS publishes four distinct ‘Analytical Living Cost Indexes’ (LCIs) based on household type that, in aggregate, account for 90% of Australian households, these being:
employee households (income principally from wages and salaries);
age pensioner households (income principally from the age pension or veterans affairs pension);
other government transfer recipient households (income principally from a government pension or benefit other than the age pension or veterans affairs pension); and
self-funded retiree households (income principally from superannuation or property, and where the defined reference person is ‘retired’).
In addition, a Pensioner and Beneficiary Living Cost Index (PBLCI) is also maintained; this index effectively blends the middle two above to cover households whose principal source of income is from government pensions and benefits.
According to the ABS, these five indexes are “specifically designed to measure changes in living costs for selected population sub-groups and are particularly suited for assessing whether or not the disposable incomes of households have kept pace with price changes.”
How do the LCIs track cost-of-living changes?
The CPI and LCIs share the same overall design and calculation methodology, both tracking price changes across the same 11 groups.
The key difference between the two relates to the cost of housing. The LCIs include interest charges on mortgages but exclude new house purchases. The CPI includes the cost of new house purchases (i.e. new builds) but does not include interest charges on mortgages.
That, as it turns out, causes the CPI and LCIs to diverge in dynamic interest rate environments (as was the case between mid-2022 and the end of 2023).
While headline CPI rose 3.6% for the year to 31 March 2024, the equivalent household inflation for the different household types is provided in the table below.
Source: ABS, Selected Living Cost Indexes, Australia (March 2024)
This shows that the largest group, employees – i.e. wage earners – were hit much harder than any other group, seeing their cost-of-living surpass CPI by 2.9% over the year.
Self-funded retiree households experienced an increase in their cost-of-living, but slightly below the headline CPI rate, as did age pensioner households.
Other government transfer recipient households (typically of working age) also fared worse than CPI.
The main driver of this divergence has been interest charges. The current weighting for this expenditure is almost 12.5% for employee households, as compared to just over 1% for self-funded retiree households and 1.6% for age pensioner households.
Source: ABS, Selected Living Cost Indexes, Australia (March 2024)
With mortgage interest charges rising 35.3% during the past year (easing from a peak of 91.6% during the June 2023 quarter compared to a year earlier), the current cost-of-living crisis for many home-owning Australians, particularly those in their thirties and forties, could perhaps be better described as a ‘cost-of-mortgage crisis’.
Sources of cost-of-living stress for retirees
Below is a selection of spending categories from the age pensioner and self-funded retiree LCIs, displaying the percentage change in index values over two years, from the start of 2022 to the end of 2023.
Employee households are included, indicating how working-age households have fared in comparison to retiree households.
Source: ABS, Selected Living Cost Indexes, Australia (March 2024, Table 2)
The two retiree groups within the LCI may have had broadly similar overall cost-of-living experiences over the past two years but with distinct differences across specific expenditure items.
The main ones being insurance premiums and mortgage interest charges.
Self-funded retiree households tend to hold more, and higher premium, insurance products. Insurance premiums have soared across house, home and contents, landlord and motor vehicle insurance over the past year, some at the highest rates since the LCIs were first introduced.
Age pensioner households, by contrast, have been more impacted by the sharp rise in interest charges since mid-2022, particularly those still servicing mortgages, but also credit cards and personal loans.
Inflation is central to any conversation on retirement because its pernicious effects erode purchasing power over time and, with it, one’s standard of living.
So central is inflation risk to retirement that it makes its presence felt right across the superannuation sector, from investment return objective setting (CPI plus targets) to retirement income forecasting (inflation-adjusting projected balances for ‘today’s dollars’).
The Retirement Income Covenant, a requirement for all APRA-regulated super funds since July 2022, also explicitly names inflation as one of three key risks that members face in retirement and that trustees must address in building retirement solutions.
But it’s patently clear that the CPI is not best placed to be a measure of inflation as experienced by households, especially once in retirement.
A lot of that is due to the CPI no longer measuring mortgage interest charges.
Some 14% of homeowners aged 65 and above still have a mortgage. Retired Australians may, therefore, increasingly be subject to mortgage rate shocks, of the kind experienced during 2022 and 2023, well into retirement.
Add to that the sharp rises in private market rental over the past 12 months, and for the 18% of those over 70 who don’t own a roof over their heads, rent inflation can impact far more than its weighting in the CPI might indicate.
The changing, increasingly tenuous nature of housing in retirement, therefore, warrants a rethink of CPI as the best measure of retiree cost-of-living pressures.
In fact, the base rate of Age Pension (itself indexed to Male Total Average Weekly Earnings) already indexes its half-yearly increases to the higher of the CPI and the PBLCI.
A case can therefore be made for self-funded retiree and age pensioner retiree households to have the relevant ABS living-cost-indexes applied to their circumstances in other areas, such as inflation indexation for retirement income products.
As the saying goes: ‘what gets measured gets managed’.
With the CPI, we’re not measuring what truly counts in retirement: maintaining a dignified standard of living irrespective of the specific cost-of-living pressures we may encounter along the way.
The TV rights bonanza has stalled, the frenzy to secure hosting rights is a thing of the past, and the Olympic’s political relevance has been reduced to who can be the most outraged over the artistic merits of the opening ceremony. Kim Wingerei and 360Info ask, what’s next?
Some Russian athletes are competing in Paris, but not under their own flag. Along with Belarus, Russia was banned from participating because of its invasion of Ukraine. Israel, on the other hand, was the first boat on the Seine at the opening ceremony in Paris last Friday, despite its invasion and mass murder campaign in Gaza.
The International Court of Justice – a UN body – declared that Israel had committed numerous violations of international law during its 57 years of occupation, ordering Israel to stop. It echoes the March 2022 ruling of the ICJ for Russia to cease its attacks on Ukraine.
To add insult to injury, at least 30 Israeli Olympians have publicly supported the Gaza war. Some have even served as IDF spokespeople, according to Karim Zidam – a New York Times and The Guardian commentator on the politics of sport.
The modern Olympics have always been a platform for political statements. In 1936, it was Adolf Hitler presenting the splendour of his Germany to a world mostly unaware of the horrors to follow. In 1968, it was the Black Power salute that took centre stage; four years later, the Munich Massacre diverted all attention away from the athletes.
In 1980, 67 countries boycotted the Moscow Olympics because of the Soviet Union’s invasion of Afghanistan. The Soviet block and some of its African vassal states retaliated and boycotted the Los Angeles Olympics.
Since then, actual boycotts and exclusions have been rare, too much money at stake, perhaps. But that, too, may be changing. As the games ventured into the new millennium, support for the games has waned.
Olympic TV right$
The enormous TV contracts that buttress the billion-dollar industry of the International Olympic Committee now seem incongruous with the reality of a broadcast market in terminal decline, while the sheer scale of the cost and logistics involved in putting on these events continue to soar.
As Alexander Faure from L’École des Hautes études en Sciences Sociales, Paris writes:
The way cities host the Olympic Games is changing. Staging the event has become such a burden, fewer cities are interested in going to the trouble.
While Tim Harcourt from the University of Technology Sydney believes that “a country doesn’t host the Olympic Games to make a profit”. Instead it places nations in the world’s shop window.
It begs the question of what relevance the Olympic movement still holds as we lurch deeper into the 21st century. If the once peripheral exploits of political posturing, national brand management, and grand advertising plays from major sponsors to captured audiences have lost their lustre, is it anything more than just the world’s largest sports carnival?
Emma Sherry from RMIT University, Melbourne, sees the opportunity for the Olympic Games to reimagine what they stand for, saying that “by providing a platform for athletes to advocate for positive change, the Olympics can reinforce their role as a force for good, promoting not just physical excellence but also social progress”.
This can be seen through Australia’s skateboarding teenagers.
Indigo Willing from the University of Sydney writes about Arisa Trew and Chloe Covell who, at just 14, are both aiming to become the youngest Australian gold medallists in a sport once dominated by hyper masculine men. Skateboarding at its second Olympics offers the opportunity for change.
One aspect that has always assumed importance with the Olympics is security. As Marco Lombardi and Maria Alvanou from the Catholic University of Sacred Heart in Milan argue, these games could be at a higher risk from terrorism than any other.
The task is now to see if the Olympic spirit that enraptured generations to create this force for global citizens, coming together to celebrate sporting excellence and togetherness, can reimagine itself for a new age, with new heroes and iconic moments to bookmark the lives of those who witness it.
Treasurer Jim Chalmers’ ‘magic wand‘ to get inflation down in the Budget is on track following RBA testimony to Parliament last night. Michael Pascoe reports.
There’s a problem for the interest rate hawks demanding more pain for mortgage holders: the Reserve Bank has bought Jim Chalmers’ downward massage of the consumer price index.
The RBA’s economics assistant governor, Sarah Hunter, said on Thursdaythe bank “broadly agreed” with Treasury’s forecasts of the impact of the budget on the CPI.
That means buying the Treasurer’s prediction that the CPI will be under 3 per cent this year and 2.75 per cent for the new financial year.
RBA’s Sarah Hunter
Accepting that the CPI will be within its target range would make it rather hard for the RBA to hike rates again, despite the urging of the well-paid economists who believe mortgage holders need to be made suffer even more. An inflation rate starting with a 2 would call for a rate cut before the RBA induces a hard landing.
This week’s retail sales figures add to the miserable picture of consumers retreating into their shells, either through the necessity of simply running out of money or the spreading mentality of “cost-of-living crisis” and the promise of higher unemployment as official policy has its way.
Dr Hunter repeated the RBA chant of inflation still being too high and inflation being the bank’s absolute focus.
The reality of the key inflation drivers is that they don’t respond to interest rates. Insurance premiums and still-surging rent are immune to the pain the RBA inflicts.
The RBA knows this and every now and then a governor will admit the frustration of their impotence.
Michele Bullock did as much in her answer to the final question of her media conference earlier this month when she was specifically asked about that frustration.
“My only thought on it is that it is the only thing we have,” she said.
“To my mind, the governments are saying the right things in trying to make sure they try not to add to inflation. As I’ve said, they have got their own particular issues to balance, policy issues to balance but they are saying the right things.
“It’s the same around the world. Central banks with their interest rates do tend to be the first port of call for affecting inflation because we have an impact on demand. We can’t impact supply. Everyone is very conscious it’s a blunt instrument, it works through particular channels and that does have different impacts on different people. But it’s a fact of life. It’s what we’ve got.”
And – failing more direct government action – what a minority of the population is belted with.
Accepting the government’s efforts to directly lower inflation – most obviously by reducing what consumers have to spend on energy – puts the RBA a step ahead of the market economists’ commentariat.
Though hawks squawk
The hawks continue to squawk about what they perceive as the underlying inflation rate and disregard the direct intervention that starts on July 1.
They also disregard the RBA’s observation that the last two interest rate rises have not made their way through the system yet. Mortgage repayments were taking 10 per cent of total household disposable income this month, but the RBA sees that rising to 10.5 per cent by the end of the year – if rates are held steady.
The government’s great hope is that the comatose consumer will be revived by the Stage 3 tax cuts without going overboard. The consumer needs reviving before the present fear becomes self-fulfilling.
The tax cuts won’t be enough to get renters and those with large mortgages out spending again on anything more than necessities, but recent surveys point to even people with the capacity to spend suggesting they are more likely to save.
The Conversation’s Peter Martin makes a more optimistic case for the impact of the national wage case and tax cuts, but it would be a brave soul to predict an outbreak of optimism without the flag of an interest rate cut by the RBA.
The next “live” meeting will be August with a new set of forecasts and richer data to consider than the monthly CPI guess that had the monetary hawks wetting themselves this week.
It also could be a new-look board – another wild card.
Aussie John Symond’s tax-free $200m home sale would not be on the cards if not for the failure of politicians to stand up to the property lobby. Michael West on the critical problem of housing and the obvious solutions.
Aussie John Symond has put his “iconic” Point Piper home on the market for $200m. What you will not see in the green-eyed and fawning media coverage is that John’s profit on the Woolsey Rd residence is tax free.
You will see amid the “exuding elegance and comfort”, “gun-barrel views of the Opera House” and stylish design of the undercover parking for 27 cars, is that John’s profit on the gaudy mausoleum will be tax-free thanks to the capital tax gains relief introduce by the John Howard government around the turn of the century.
That is, if the house owes the founder of Aussie Home Loans $40m, he makes a tax free profit of $160m if he achieves the $200m asking price.
How much has this CGT giveaway for wealthy baby boomers contributed to the outrageous surge in property prices in Australia – up another 20% even over the past year? It’s hard to tell exactly but this chart would indicate it is certainly one factor.
Check out how residential property prices begain to soar above household income from around the time the measure was introduced.
The housing affordability and rental crises have economists in furious debate over cause. Yes, negative gearing, Airbnb, money laundering, supply, unfettered migration and the spree of foreign buyers all play a part.
Overall, this cocktail of factors – mostly due to the policies of successive governments – amounts to one deadly outcome which has seen Sydney’s future branded as the city with no grandchildren and the second most expensive city in the world for real estate after Hong Kong.
Simply, investors have been encouraged to compete with people wanting somewhere to live. It is a gangantuan policy fail whose impact will be felt for generations.
And indisputably, the benefits fall to the wealthy over ordinary Australians.
Screenshot
Yet, in the recent Budget and indeed in Peter Dutton’s Budget Reply, none of these things were raised. Well, apart from Dutton proposing a band-aid 2-year ban on foreign buyers and large migration cuts. But negative gearing and so forth were not raised. And negative gearing is a substantial cause – it goes to the overall mollycoddling of investors over home-buyers.
And as Greg Jericho points out in this chart above, the CGT changes “set fire” to negative gearing. So it is not as though our elected officials have no measures to address the crisis. They are staring us all in the face.
So it is that we are seeing a ‘mansion flipping epidemic’ of wealthy people selling their ‘family homes’ after a few years to lock in large tax-free profits. This could easily be capped. Of course, it makes no sense in terms of policy as real estate is a fairly non-productive asset. If capital were diverted elsewhere to equity or business investment it would create more jobs and more growth.
One aspect mostly ignored however is how the deluge of foreign cash has set fire to both the CGT and negative gearing lurks. This is because it is mostly secret. Much of the money coming out of China is ‘black money’. Chinese nationals are only allowed to take a certain amount of cash out and so their are ways to skirt these restrictions.
This is why lawyers, accountants and property developers have been lobbying against AML-CTF laws (money laundering) which were supposed to be introduced 17 years ago.
This has led to what the ‘property porn’ media has dubbed an ‘arms race‘ at the top end. Although supporters may decry this phenomenon as contained to the ‘top end’, there are ripple effects across the whole sector. The top end drags up all prices. So we see ludicrous prices achieved at auction month after month.
For instance, this North Bondi house sale for $10.7m.
Thanks to the mansion flipping epidemic, there were 48billion in capital gains tax concessions on “main residences last year. So, if you have just found yourself in a tent, rest assured, if you still have a job and pay tax you are at least helping to subsidise somebody else’s home.
PM Anthony Albanese was asked earlier this year if taxing the family home might be on the cards. No. “Full stop. Exclamation mark”.
Taxing the family home is political poison. Because the minute any reasonable proposition was plonked on the table, some lobby group and their PR people would be out of the blocks with a campaign in Murdoch media or Nine showing an old couple on zimmer frames looking beleaguered, saying, “we bought our home for 25k back in 1952 and now they want to tax us out of our nursing home …”
The ripple effect of outrageous prices is that younger workers are being forced out of metropolitan markets, in turn forcing prices rapidly higher in the regions where they can afford to buy.
In turn, this makes property unaffordable for ordinary workers in the regions who are compelled to spend ever larger proportions of their income to find a home while interest rates rise.
On the flip-side, of the 122,494 people experiencing homelessness in Australia in 2021, two in five (39.1%) were living in ‘severely’ crowded dwellings. One in five (19.8%) were in supported accommodation for the homeless. One in six (18.1%) living in boarding houses.
The crisis is deepening, and the measures are there to fix it, just not the political will. Harry Chemay lays out the problems and the solutions in his Housing Hunger Games trilogy.