Hawaiʻi’s main utility is poised to radically revise how it compensates households for the power their batteries send to the grid, a move critics fear will stunt the potential for using that energy to prevent blackouts and hinder the state’s transition to 100 percent clean energy.
Hawaiian Electric, which serves every island except Kauaʻi, will launch the Bring Your Own Device program on April 1, offering households incentives to deliver power during peak demand. But the compensation is nowhere near what customers who joined an earlier battery program received, and some solar advocates worry it’s so low that people may not enroll at all.
That would be a missed opportunity to help build a modern energy system, said Rocky Mould, executive director of the Hawaiʻi Solar Energy Association. “It’s depriving us of the potential for a really viable grid service program that would benefit all. We should be moving as fast as we can to get off oil.”
The utilities and regulators favoring reductions say the credits are too costly for the ratepayers who subsidize them — a point Hawaiian Electric made to Grist in supporting the changes. Supporters of incentives argue that rollbacks can impede solar’s growth, prolong dependence on fossil fuels, and undermine energy resilience.
Hawaiʻi is under a legal mandate to use only clean energy by 2045, and has long been a leader in rooftop solar adoption, which comprises almost half of Hawaiian Electric’s renewable generation portfolio. But when it slashed compensation rates in 2015, installations dropped by more than half. The market recovered as customers found a new way to save money: Adding batteries and consuming stored power at night rather than buying it from the utility. Nearly every photovoltaic system installed now includes at least one battery.
Nearly all home solar installations include storage now, giving Hawaiʻi the highest battery attachment rate of any state in the U.S.
Courtesy of RevoluSun
In 2021, as the state prepared to shutter its last coal power plant, it needed those batteries. With utility-scale renewable projects behind schedule, the state faced a generation shortfall. If households allowed Hawaiian Electric to tap their batteries, a resource called a virtual power plant, it could supply some of the capacity lost when the plant went offline.
Homeowners would need an incentive to do that, so Hawaiian Electric rolled out Battery Bonus. Customers on Oʻahu and Maui who agreed to let the utility draw power for two hours each evening, when demand is at its peak, received an upfront payment based on the size of their battery. They also earned a monthly incentive of $5 per kilowatt committed and a credit equivalent to the retail rate (the highest in the nation) for the electricity they contributed. On average, customers received around $4,250 when they signed up, a regular payment of $25 monthly, and a healthy discount on their bill.
The program was highly popular, especially on Oʻahu. “We already had a lot of traction with our customers installing batteries with their systems, but when they shut down the coal plant and introduced Battery Bonus, it just poured rocket fuel on the fire,” said David Gorman, co-founder and president of RevoluSun, the largest solar installer on the island. Still, Battery Bonus was a temporary program tied to the coal plant’s closure. Hawaiian Electric stopped accepting new signups on Oʻahu in December after the island reached its maximum enrollment capacity of 40 megawatts. (The program remains open on Maui, which has not yet reached its cap.)
Virtual power plants, or VPPs, allow states to reduce reliance on fossil fuel power plants and tap into clean energy without the costs and delays associated with building utility-scale projects. But the approach is dependent upon customer participation, and the incentives offered in Bring Your Own Device may not prove as compelling. The upfront payment is capped at $500, a small dent in the typical $9,500 purchase price for a battery.
Solar advocates are even more concerned about how Hawaiian Electric plans to pay households for their power. For most customers, the rates paid in the program set to take effect next month are far lower than the retail price of electricity. Although the batteries will serve the household’s load before exporting energy to the grid, customers will pay the retail rate for any power they need once the pack is depleted.
“It’s disincentivizing customers from participating,” said Mould, who added that a more complicated rate structure also could make the systems difficult to sell. “When you’re sitting across the proverbial kitchen table from a customer and selling these things, you really need something that’s simple and where the value proposition is easy to explain.”
Solar advocates fear that a lower and more complicated compensation structure will deter households from participating in grid programs. Courtesy of RevoluSun
Gorman said the new program won’t necessarily cause solar installations to plummet like the changes to net metering did, but he agrees it could undercut VPP participation. “The electricity rates are so high that you don’t need those upfront incentives and rebates in order to think going solar is a good idea,” he said. “A PV plus storage system still has a very attractive payback period.”
In other words, customers may still get batteries, but they’ll keep that power for themselves. Widespread abstention from grid programs would undermine efforts to rein in electricity prices and meet Hawaiʻi’s clean energy goals, said Issac Moriwake, managing attorney for Earthjustice’s mid-Pacific region who was part of an appeal to the Hawaiʻi Public Utilities Commission to revise parts of the BYOD program.
“You ought to consider the big picture of how not only individual systems, but the aggregate, are able to respond to grid needs on call, and respond to emergencies,” said Moriwake. “There’s big-time value there.”
A system in which customers use their stored power only for their own needs is fundamentally inefficient, Moriwake added. “You’re talking about the utility spending gazillions of dollars to build their own huge utility-sized battery, and then customers are getting their own batteries, just duplicating investments and duplicating efforts,” he said.
In an emailed statement, a representative for Hawaiian Electric told Grist the new program is meant to keep rates affordable for customers who don’t have rooftop solar systems.
“Hawaiian Electric understands the position expressed by solar advocates,” the statement said. “However, there is an equity issue that must be considered as Hawaiian Electric rolls out these incentive programs. While we want to encourage customers to enroll in our programs, we also want to ensure the costs for the programs are spread fairly across customers, including those who are facing financial challenges.”
Moriwake said that position loses sight of the urgent need for Hawai’i to move beyond fossil fuels. Despite being among the first states to set clean energy targets, Hawaiʻi relies on imported oil to meet 75 percent of its electricity consumption. “I think particularly in the era of climate emergency, let alone brownouts and supply shortfalls, that we have to move past the nickel and diming around getting the rooftop solar compensation exactly right,” he said.
Hawaiʻi has also found itself grappling with generation shortages. On January 8, for the first time in almost a decade, failures at an Oʻahu oil-burning power plant coupled with a shortage in utility-scale stored energy caused an outage and led the utility to ask customers to conserve energy as it instituted rolling blackouts across the island. Home batteries enrolled in Battery Bonus kicked in, but that wouldn’t have been enough to meet demand.
“It begs the question, had we had a fully subscribed, operational program, what number would it have taken to avoid the blackouts altogether?” Mould said.
Hawaiian Electric also stressed that reducing demand also provides its own service to the grid. “The goal of BYOD is to reduce system wide load during the evening peak when demand for electricity on the grid is typically the highest. When a customer consumes energy from their battery on site, they’re offsetting their load and helping achieve that goal.”
Those concerned about the new program await its impacts. Its rollout was to begin March 1, but was delayed a month to give the utility time to implement changes ordered by the utilities commission based on early objections to the program. Legislation to mandate retail-rate compensation is also pending, but won’t be heard this session. Solar advocates remain hopeful that, if enrollment remains low, Hawaiian Electric will adjust its compensation.
That’s what happened with Battery Bonus. When the utility introduced the program, it was more restrictive in who could participate and offered fewer incentives. Enrollments stalled, and as the power plant closure loomed, Hawaiian Electric upped the incentives. Participation picked up.
A licence-free export arrangement for technologies with dual civilian and military uses represents a commercial opportunity for Australia, according to the United States’ under secretary for arms control and international security, Bonnie Jenkins. Ms Jenkins made the comments amid ongoing concerns from local industry and researchers about proposed changes to the Defence trade controls regime…
In October 2021, an assistant U.S. attorney issued a subpoena to Signal demanding that the messaging app hand over information about one of its users. Based on a phone number, the federal prosecutors were asking for the user’s name, address, correspondence, contacts, groups, and call records to assist with an FBI investigation. Two weeks later, the American Civil Liberties Union responded on behalf of Signal with just two pieces of data: the date the target Signal account was created, and the date that it last connected to the service.
That’s it. That’s all Signal turned over because that’s all Signal itself had access to. As Signal’s website puts it, “It’s impossible to turn over data that we never had access to in the first place.” It wasn’t the first time Signal has received data requests from the government, nor was it the last. In all cases, Signal handed over just those two pieces of data about accounts, or nothing at all.
Signal is the gold standard for secure messaging apps because not only are messages encrypted, but so is pretty much everything else. Signal doesn’t know your name or profile photo, who any of your contacts are, which Signal groups you’re in, or who you talk to and when. (This isn’t true for WhatsApp, Telegram, iMessage, and nearly every other messaging app.)
Still, one of the main issues with Signal is its reliance on phone numbers. When activists join Signal groups for organizing, they’ve been forced to share their phone number with people they don’t yet know and trust. Journalists have had to choose between soliciting tips by publishing their private numbers to their readers — and therefore inviting harassment and cyberattacks — or setting up a second Signal number, a challenging and time-consuming prospect. Most journalists simply don’t publish a Signal number at all. That’s all about to change.
With the long-awaited announcement that usernames are coming to Signal — over four years in the making — Signal employed the same careful cryptography engineering it’s famous for, ensuring that the service continues to learn as little information about its users as possible.
“Doing it encrypted is the boss level. We had to change fundamental pieces of our architecture.”
“Doing it encrypted is the boss level,” said Meredith Whittaker, president of the nonprofit Signal Foundation, which makes the app. “We had to change fundamental pieces of our architecture.”
If Signal receives a government request for information about an account based on an active username, Signal will be able to hand over that account’s phone number along with its creation date and last connection date. So being able to use Signal through usernames doesn’t mean your phone number becomes subpoena-proof — at least not without using the new ability to change your username at will.
That’s because the new Signal usernames are designed to be ephemeral. You can set one, delete it, and change it to something else, as often as you want.
Signal usernames are currently available in Signal Desktop and the beta version of the Signal mobile apps — those will get updated in the coming weeks too. My username is micah.01, if you want to drop me a message.
Signal’s New Phone Number Privacy
With the new version of Signal, you will no longer broadcast your phone number to everyone you send messages to by default, though you can choose to if you want. Your phone number will still be displayed to contacts who already have it stored in their phones. Going forward, however, when you start a new conversation on Signal, your number won’t be shared at all: Contacts will just see the name you use when you set up your Signal profile. So even if your contact is using a custom Signal client, for example, they still won’t be able to discover your phone number since the service will never tell it to them.
You also now have the option to set a username, which Signal lets you change whenever you want and delete when you don’t want it anymore. Rather than directly storing your username as part of your account details, Signal stores a cryptographic hash of your username instead; Signal uses the Ristretto 25519 hashing algorithm, essentially storing a random block of data instead of usernames themselves. This is like how online services can confirm a user’s password is valid without storing a copy of the actual password itself.
“As far as we’re aware, we’re the only messaging platform that now has support for usernames that doesn’t know everyone’s usernames by default.”
“As far as we’re aware, we’re the only messaging platform that now has support for usernames that doesn’t know everyone’s usernames by default,” said Josh Lund, a senior technologist at Signal.
The move is yet another piece of the Signal ethos to keep as little data on hand as it can, lest the authorities try to intrude on the company. Whittaker explained, “We don’t want to be forced to enumerate a directory of usernames.”
To prevent people from squatting on high value usernames — like taylorswift, for example — all usernames are required to have a number at the end of them, like taylorswift.89. Once you’ve set a username, other Signal users can start a conversation with you by searching for your username, all without learning your phone number.
Since usernames are designed to be ephemeral, you can set a new username specifically for a conference you’re attending, or for a party. People can connect with you using it, and then you delete it when you’re done and set it to something else later.
There are some cases you might want your username to be permanent. For example, it makes sense for journalists to create a username that they never change and publish it widely so sources can reach out to them. Journalists can now do that without having to share their private phone number. It makes sense for sources, on the other hand, to only set a username when they specifically want to connect with someone, then delete it afterward.
You can also create a link or QR code that people can scan to add you as a contact. These, too, are ephemeral. You can send someone your Signal link in an insecure channel, and, as soon as they contact you, you can reset your link and get a new one, without needing to change your username.
Finally, while you’ll still need a phone number to create a Signal account, you’ll have the option to prevent anyone from finding you on Signal using your phone number.
Can Signal Hand Over Your Phone Number Based on a Username?
Whenever Signal receives a properly served subpoena, they work closely with the American Civil Liberties Union to challenge and respond to it, handing over as little user data as possible. Signal publishes a post to the “Government Requests” section of their website (signal.org/bigbrother) whenever they’re legally forced to provide user data to governments, so long as they’re allowed to. Some of the examples include challenges to gag orders, allowing Signal to publish the previously sealed court orders.
If Signal receives a subpoena demanding that they hand over all account data related to a user with a specific username that is currently active at the time that Signal looks it up, they would be able to link it to an account. That means Signal would turn over that user’s phone number, along with the account creation date and the last connection date. Whittaker stressed that this is “a pretty narrow pipeline that is guarded viciously by ACLU lawyers,” just to obtain a phone number based on a username.
Signal, though, can’t confirm how long a given username has been in use, how many other accounts have used it in the past, or anything else about it. If the Signal user briefly used a username and then deleted it, Signal wouldn’t even be able to confirm that it was ever in use to begin with, much less which accounts had used it before.
If the Signal user briefly used a username and then deleted it, Signal wouldn’t even be able to confirm that it was ever in use to begin with.
In short, if you’re worried about Signal handing over your phone number to law enforcement based on your username, you should only set a username when you want someone to contact you, and then delete it afterward. And each time, always set a different username.
Likewise, if you want someone to contact you securely, you can send them your Signal link, and, as soon as they make contact, you can reset the link. If Signal receives a subpoena based on a link that was already reset, it will be impossible for them to look up which account it was associated with.
If the subpoena demands that Signal turn over account information based on a phone number, rather than a username, Signal could be forced to hand over the cryptographic hash of the account’s username, if a username is set. It would be difficult, however, for law enforcement to learn the actual username itself based on its hash. If they already suspect a username, they could use the hash to confirm that it’s real. Otherwise, they would have to guess the username using password cracking techniques like dictionary attacks or rainbow tables.
Why Does Signal Require Phone Numbers at All?
Signal’s leadership is aware that its critics’ most persistent complaint is the phone number requirement, and they’ll readily admit that optional usernames are only a partial fix. But because phone numbers make it simpler for most people to use Signal, and harder for spammers to make fake accounts, the phone number requirement is here to stay for the foreseeable future.
Signal doesn’t publish how many users it has, but the Android app boasts over 100 million downloads. It has achieved this scale largely because all you need to do is install the Signal app and you can immediately send encrypted messages to the other Signal users in your phone’s contacts — based on phone numbers.
“You reach a threshold where you’re actually reducing privacy.”
This ease of use also makes Signal more secure. If Signal removed phone numbers, making it more difficult for Signal users to find each other compared to using alternative messaging apps, there could be a price to pay. “You reach a threshold where you’re actually reducing privacy,” Whittaker said. She gave an example of a person who faces severe threats and normally maintains vigilance but whose mother is only on WhatsApp because she can’t figure out the numberless Signal. The high-threat person would be stuck using the less secure option more often.
Requiring phone numbers also makes it considerably harder for spammers to abuse Signal. “The existence of a handful of small apps that don’t really have a large scale of users, that don’t require phone numbers, I don’t think is proof that it’s actually workable for a large-scale app,” Whittaker said.
It’s entirely possible to build a version of Signal that doesn’t require phone numbers, but Whittaker is concerned that without the friction of obtaining fresh phone numbers, spammers would immediately overwhelm the network. Signal engineers have discussed possible alternatives to phone numbers that would maintain that friction, including paid options, but nothing is currently on their road map.
“That’s actually the nexus of a very gnarly problem space that I haven’t seen a real solution for from any alternatives, and we would want to tread very, very cautiously,” Whittaker said. “There’s one Signal. We’re the gold standard for private messaging, and we have achieved critical mass at a pretty large scale. Those things couldn’t easily be recreated if we fuck this up by making a rash decision that then makes it a spammy ghost town. That’s the concern we’re wrestling with here.”
The Western Australian government has set aside $140 million over the next decade to deliver a digital twin for the state, which will eventually be made available to public and private sector use. The whole-of-government program is called Spatial WA and was jointly announced on Friday by Planning, Lands, and Housing minister John Carey and…
Taylor Swift is just one of countless victims of deepfake videos. Firms feeding off this abuse should pay for the harm they cause
Imagine finding that someone has taken a picture of you from the internet and superimposed it on a sexually explicit image available online. Or that a video appears showing you having sex with someone you have never met.
Imagine worrying that your children, partner, parents or colleagues might see this and believe it is really you. And that your frantic attempts to take it off social media keep failing, and the fake “you” keeps reappearing and multiplying. Imagine realising that these images could remain online for ever and discovering that no laws exist to prosecute the people who created it.
WASHINGTON — U.S. semiconductor firms must strengthen oversight of their foreign partners and work more closely with the government and investigative groups, a group of experts told the Senate Committee on Homeland Security and Governmental Affairs, saying the outsourcing of production overseas has made tracking chip sales more difficult, enabling sanctions evasion by Russia and other adversaries.
U.S. semiconductor firms largely produce their chips in China and other Asian countries from where they are further distributed around the world, making it difficult to ascertain who exactly is buying their products, the experts told the committee at a hearing in Washington on February 27.
The United States and the European Union imposed sweeping technology sanctions on Russia to weaken its ability to wage war following its full-scale invasion of Ukraine in February 2022. Russia’s military industrial complex is heavily reliant on Western technology, including semiconductors, for the production of sophisticated weapons.
“Western companies design chips made by specialized plants in other countries, and they sell them by the millions, with little visibility over the supply chain of their products beyond one or two layers of distribution,” Damien Spleeters, deputy director of operations at Conflict Armament Research, told senators.
He added that, if manufacturers required point-of-sale data from distributors, it would vastly improve their ability to trace the path of semiconductors recovered from Russian weapons and thereby identify sanctions-busting supply networks.
The banned Western chips are said to be flowing to Russia via networks in China, Turkey, Central Asia, and the Caucasus.
Spleeters said he discovered a Chinese company diverting millions of dollars of components to sanctioned Russian companies by working with U.S. companies whose chips were found in Russian weapons.
That company was sanctioned earlier this month by the United States.
‘It’s Going To Be Whack-A-Mole’
The committee is scrutinizing several U.S. chip firms whose products have turned up in Russian weapons, Senator Richard Blumenthal (Democrat-Connecticut) said, adding “these companies know or should know where their components are going.”
Spleeters threw cold water on the idea that Russia is acquiring chips from household appliances such as washing machines or from major online retail websites.
“We have seen no evidence of chips being ripped off and then repurposed for this,” he said.
“It makes little sense that Russia would buy a $500 washing machine for a $1 part that they could obtain more easily,” Spleeters added.
In his opening statement, Senator Ron Johnson (Republican-Wisconsin) said he doubted whether any of the solutions proposed by the experts would work, noting that Russia was ramping up weapons production despite sweeping sanctions.
“You plug one hole, another hole is gonna be opening up, it’s gonna be whack-a-mole. So it’s a reality we have to face,” said Johnson.
Johnson also expressed concern that sanctions would hurt Western nations and companies.
“My guess is they’re just going to get more and more sophisticated evading the sanctions and finding components, or potentially finding other suppliers…like Huawei,” Johnson said.
Huawei is a leading Chinese technology company that produces chips among other products.
James Byrne, the founder and director of the open-source intelligence and analysis group at the Royal United Services Institute, said that officials and companies should not give up trying to track the chips just because it is difficult.
‘Shocking’ Dependency On Western Technology
He said that the West has leverage because Russia is so dependent on Western technology for its arms industry.
“Modern weapons platforms cannot work without these things. They are the brains of almost all modern weapons platforms,” Byrne said.
“These semiconductors vary in sophistication and importance, but it is fair to say that without them Russia … would not have been able to sustain their war effort,” he said.
Byrne said the depth of the dependency on Western technology — which goes beyond semiconductors to include carbon fiber, polymers, lenses, and cameras — was “really quite shocking” considering the Kremlin’s rhetoric about import substitution and independence.
Elina Ribakova, a Russia expert and economist at the Peterson Institute for International Economics, said an analysis of 2,800 components taken from Russian weapons collected in Ukraine showed that 95 percent came from countries allied with Ukraine, with the vast majority coming from the United States. The sample, however, may not be representative of the actual distribution of component origin.
Ribakova warned that Russia has been accelerating imports of semiconductor machine components in case the United States imposes such export controls on China.
China can legally buy advanced Western components for semiconductor manufacturing equipment and use them to manufacture and sell advanced semiconductors to Russia, Senator Margaret Hassan (Democrat-New Hampshire) said.
Ribakova said the manufacturing components would potentially allow Russia to “insulate themselves for somewhat longer.”
Ribakova said technology companies are hesitant to beef up their compliance divisions because it can be costly. She recommended that the United States toughen punishment for noncompliance as the effects would be felt beyond helping Ukraine.
“It is also about the credibility of our whole system of economic statecraft. Malign actors worldwide are watching whether they will be credible or it’s just words that were put on paper,” she said.
After the Willy Wonka Glasgow immersive experience was compared to a “meth lab”, the police were called, and punters were left furious – now there’s even a birthday card people can buy, which is currently going viral.
On X, people were pointing out that the Willy Wonka Glasgow experience was essentially a scam. Organisers used AI technology to create the website and ad campaign – which led people to believe the event was going to be spectacular:
apparently this was sold as a live Willy Wonka Experience but they used all AI images on the website to sell tickets and then people showed up and saw this and it got so bad people called the cops lmao pic.twitter.com/tfkyg0G0WG
However, it was quite obvious from the website that something wasn’t quite right:
Not removing the blame on the event company for the £35 Willy Wonka experience but this was literally the advert on the site you saw before choosing to book pic.twitter.com/fTILnlFVcl
Of course – and somewhat predictably – the failed event is already being hailed as one of the moments of 2024:
This photo from the Willy wonka experience is single handedly the photo of the year. I know it’s only February but close the vote there’s no topping this. Please find this woman she needs to be interviewed ASAP pic.twitter.com/97wsodLLpQ
And, as if by magic, you can now buy Willy Wonka disaster-themed merch marking the real-world dramedy.
A birthday card? Yes, it exists already.
thortful is an online greetings card marketplace, providing a platform for independent creatives to sell their designs from all over the globe. thortful pay their creators an industry-leading royalty rate each time one of their card designs are sold, as well as handling all production and customer queries, providing a quick and easy service for both customers and sellers.
Now, it’s platforming a birthday card inspired by the Willy Wonka Glasgow disastrous event.
The card from thortful reads “For your birthday I thought I’d treat you to a ticket to The Wonka Experience,” with an image of the event that went completely wrong.
A spokesperson from thortful commented on the new card:
We feel sorry for the people that were looking forward to an exciting day out, so we wanted to create something for people to see the funny side of it.
The Willy Wonka Glasgow card is available to buy here.
Over summer, BroadAgenda is featuring a short series of profiles on amazing women and LGBTIQ + folks. You’re about to meet Dr Maryam Ghahramani.She’s a Lecturer in engineering with the Faculty of Science and Technology, University of Canberra.
If you were sitting next to someone at a dinner party, how would you explain your work and research in a nutshell?
I like to think of myself as the female version of Galileo in the field of human motion and balance! Just like Galileo said, “If it’s measurable, measure it; if it’s not, make it measurable.” That’s my motto.
I measure human motion, balance, mobility, and motor function. Why? I do it to assist in diagnosing conditions that affect motor function, like Parkinson’s disease or dementia, and to aid in mobility assessment and rehabilitation, particularly for older individuals.
What are you currently working on that’s making you excited or that has legs?
Currently, I am focused on a project aimed at developing models that, in the long run, can diagnose younger onset dementia. We’re employing various sensors to assess motion and brain activity, alongside machine learning techniques.
This project particularly is really exciting for me. Despite the common belief, dementia isn’t just for older people and there have been cases as young as 35! This is really tough because many of these people actively raise families and have full time jobs. Unfortunately, most dementia studies primarily concentrate on older people, despite the differing needs of younger individuals with dementia.
Dr Maryam Ghahramani beleives that “when we lack diversity in engineering and tech, the resulting products tend to be biased towards the majority, which in this case, are men.”
For people with younger onset dementia (YOD), it’s often their spouses who become their caregivers, a role that can be incredibly overwhelming. Not only do they face the emotional challenge of witnessing their partner’s decline, but they also find themselves solely responsible for managing family affairs and providing care.
In this project, our aim is to develop a method for early diagnosis using technology and machine learning. We hope that this method will enable us to introduce interventions that can effectively slow down the progression of symptoms and enhance independence for individuals with younger onset dementia.
Let’s wind back the clock a bit. Why did you go into this field? What was compelling about it? Feel free to dredge up childhood memories and bring colour in here.
Well, I’ve always had a thing for mathematics, and at some point, I got really intrigued by electronics. I vividly remember the excitement I felt at the age of 8 when I assembled a basic circuit, a small setup of a tiny light, two wires, and a battery.
I guess that eventually led me to realise that I wanted to pursue something related to both —engineering. Also, being Iranian, I’ve noticed that many women in Iran are drawn to engineering, despite the unequal opportunities for women in the workforce. It’s almost like an unconscious pull towards roles traditionally seen as “masculine.” Perhaps, in a way, it’s our form of resistance.
What impact do you hope your work has?
What I absolutely love about my field of research is its complete multidisciplinarity. It’s this fusion of health, engineering, and technology, which couldn’t be more essential in today’s world. Technology is a huge part of our lives, and finding new ways to use it for a better human life and well-being gets me really excited. It’s something I always emphasise to prospective and younger students: the field of engineering and technology, and later research within it, is incredibly diverse.
We’ve moved far beyond traditional engineering into a realm of endless possibilities. That’s what makes it so exhilarating and continually evolving.
I’m really hoping to see more women get into engineering, tech, and research, shaping a brighter future for all.
Do you view yourself as feminist researcher? Why? Why not? What does the word mean to you in the context of your own values and also your work?
I definitely see myself as a feminist, and that has significantly influenced my career and research path. I come from a country where women were not given equal opportunities to men in many areas of life. I’ve always fought against these inequalities and strived to push boundaries, often without even realising it.
Coming from a place that women are suppressed, I carry a lot of baggage, but I’ve learned to cope with it and turn those challenges into positive outcomes. As a result, I’ve been, am, and will continue to be the biggest advocate for women in STEM fields, particularly those hailing from underprivileged countries, and I’ll always support women in engineering.
What have you discovered in your work that has most surprised or enchanted you?
As a researcher and academic, what’s surprised me the most is how much I learn from students, whether they’re PhD candidates or undergraduates. It’s the most exciting and enjoyable aspect of my work. It’s a continuous journey of learning, where you discover how to learn more and more from everyone around you.
Is there anything else you want to say?
As I mentioned earlier, engineering and technology offer a vast array of opportunities and possibilities that seem limitless.
What I truly hope for is the inclusion of more women and individuals of other genders in this field, bringing with them their unique perspectives and ways of thinking, which unfortunately have been underrepresented in technology and engineering for many decades, even centuries.
When we lack diversity in engineering and tech, the resulting products tend to be biased towards the majority, which in this case, are men. It’s imperative that we strive for a more diverse workforce to ensure that our innovations are truly representative of society as a whole.
All peace advocates know that the military industrial complex needs people to live in fear in order for their propaganda to work, in order to get people into a warring mood. Well, Glenn Greenwald recently described how government officials are stoking the current Sinophobia, which could get the U.S. into a very hot war with a superpower:
…whenever state officials start trying to increase the fear that the population has about some threat, foreign or domestic, it’s always in the way of insisting that they need more power to protect you from that threat that they’ve got you to fear, and that is precisely when skepticism should be at its highest point since that’s always the tactic that states use to gain more authoritarian power. Putting the population in fear of some threat, and then telling them that only greater powers on the part of the state can protect you from the threat. That is precisely what is happening here, with TikTok performing the role of Iraqi WMD’s, or Kremlin disinformation, or Trump’s insurrection. (Clip starts at 11:30).
Part of the fear about China has been the assumption of guilt for some vaguely-defined kind of crime, where they were said to be directly or indirectly responsible for the COVID-19 disaster, but this racist assumption should be more easily thrown into doubt now, when we know that our understanding of COVID-19 was manipulated through a filter of censorship by the U.S. “national security state.” This has been known for many months, but recently the U.S. House Judiciary Weaponization Committee has investigated the censorship, even to the benefit of the Left and we have learned that the Global Engagement Center was using artificial intelligence (AI) to censor Americans during the “2020 election and the COVID-19 pandemic”; the Atlantic Council has been using “weapons of mass deletion” on us with the Department of Homeland Security (DHS) and the State Department; and the Virality Project once flagged a tweet from Rep. Tom Massie for the non-crime of citing research “showing that natural immunity provided the same effectiveness as the Pfizer vaccine.”
Here, I would like to propose to you, someone who cares about peace, that people who tell us that we need to invest more in “biosecurity” or “biodefense,” or tell us that we need censorship in order to be protected from the dangers of misinformation are exaggerating the threat of natural viruses, bioweapons, and bioterrorists, and that our fear about such threats provides the military industrial complex with further power and control over our lives. As I argued in March 2021, ever since the 9/11 attack, the governments of the U.S. and Japan have engaged in fearmongering in order to establish “states of exception.” First, for both countries, there was the state of exception that came in the aftermath of 9/11. The second, for Japan, was after “3/11,” i.e., the Tōhoku earthquake and tsunami that occurred on the 11th of March 2011, sparking the Fukushima Daiichi Nuclear Disaster. And the third, in my view, was the COVID-19 crisis that began in 2020: a period of violations of the Constitution of Japan, state-sponsored lawlessness, and violations of human rights. In February 2022 I warned about people getting into a warring mood over SARS-CoV-2.
From the beginning, back in March of 2020, the public health measures for the virus were described in terms of a war. On the 11th of that month, when the World Health Organization (WHO) officially announced the global pandemic, Dr. Tedros Adhanom Ghebreyesus, the director-general of the organization, himself described what we must do in terms of fighting: “So every sector and every individual must be involved in the fights,” he said.
Admittedly his “fightin’ words” were relatively mild, but on the same day, then U.S. President Donald Trump, pugnacious as always, announced a suspension of travel from Europe, saying, “We have been in frequent contact with our allies, and we are marshaling the full power of the federal government and the private sector to protect the American people. This is the most aggressive and comprehensive effort to confront a foreign virus in modern history.” On the 13th, when he announced the national emergency, he said, “Today I’d like to provide an update to the American people on several decisive new actions we are taking in our very vigilant effort to combat and ultimately defeat the coronavirus.”
Similarly, President Emmanuel Macron on the 16th in an address to the nation of France, declared, “We are at war… the enemy is invisible and it requires our general mobilization.” And on the 25th, the U.S. Joint Chiefs Chairman General Mark Milley, said during a conference call to troops, “We are at war… It’s a different type of war, but a war nonetheless.”
Many government officials around the world described their measures, or countermeasures, in such terms, and their actions were consistent with their words. They directed government officials, scientists, doctors, etc. to approach the efforts for health as if we were at war.
China was blamed for COVID-19 right from the beginning in 2020 just as Iraq was initially blamed for the anthrax attacks of 2001. Typically, they blame first and investigate later. In the words of a journalist writing for the China Daily,
US economist Jeffrey Sachs, who heads the Lancet COVID-19 Commission, said that once the outbreak began, Washington blamed China entirely, and even refused to cooperate with China to stop the pandemic. In 2020 Trump repeatedly attacked China and even withdrew from the WHO after accusing the body of favoring China. Since the early 2010s, the US has been escalating its containment efforts against China by taking unilateral trade measures, imposing technology barriers, investment and financial barriers, and other sanctions, and by forging military alliances such as AUKUS, Sachs said.
Regardless of who sparked fear of anthrax in the hearts of Americans when we were still reeling from the shock of the 9/11 attacks, one could argue that what kickstarted the U.S. biodefense industry was, more than anything else, this one case of the anthrax attacks.
Robert Kadlec
A primary beneficiary of the anthrax attacks was Robert Kadlec. Many years before serving as the Assistant Secretary of Health and Human Services (HHS) from 2017 to 2021, Kadlec had worked as a U.S. Air Force physician for 26 years. After the anthrax-tainted letters killed 5 people, infected 17 or 18, and put 30,000 on antibiotics, beginning only one week after 11 September 2001, he played a central role in spreading biodefense hysteria. “The 2001 attacks created a huge new market for biodefense and the [U.S.] government began filling the stockpile with treatments for anthrax and smallpox.”
Kadlec “served two tours of duty at the White House Homeland Security Council, first as the Director for Biodefense then as Special Assistant to President Bush for Biodefense Policy from 2007 to 2009.” Three years later, in the summer of 2012, he formed the small biodefense company East West Protection with two others. Records show that he was managing director and a part-owner of the firm.
He also worked as a “self-employed biosecurity consultant,” which earned him more than $451,000 in 2014. “Kadlec reported that 13 clients had each paid him more than $5,000 for consulting work between 2013 and 2014, including a pharmaceutical trade group, an industry lobbying organization and companies such as Emergent [BioSolutions] and Danish pharmaceutical company Bavarian Nordic. He promoted the companies’ medical products overseas, said a senior [Health and Human Services] official with knowledge of Kadlec’s work, speaking on the condition of anonymity to discuss sensitive matters.”
Emergent BioSolutions was originally called BioPort. In 1998 they were producing an anthrax vaccine called BioThrax for U.S. soldiers. That vaccine caused some severe side effects. BioPort was the sole producer of the BioThrax vaccine. The company was founded by Fuad El-Hibri, a Lebanese-German businessman, and Admiral William J. Crowe Jr., a former chairman of the Joint Chiefs of Staff and President Bill Clinton’s Ambassador to the U.K.
In August 2017, Kadlec was hired by Trump as the Assistant Secretary of Preparedness and Response (ASPR), President Trump’s top official for public health preparedness. After he gained this position, he “began pressing to increase government stocks of a smallpox vaccine. [Kadlec’s] office ultimately made a deal to buy up to $2.8 billion of the vaccine from a company that once paid [him] as a consultant, a connection he did not disclose on a Senate questionnaire when he was nominated.”
Even mass media reports indicate that Kadlec’s office has rewarded his former employer Emergent handsomely for their many millions of dollars of investments in lobbying, including “$535 million to supply a product that treats side effects caused by smallpox vaccinations in a small percentage of patients,” $260 million for an anthrax vaccine, $67.1 million for cyanide exposure, and $22 million for developing a covid-19 therapy.
The Washington Post has “identified at least 18 projects that won funding [from the U.S. National Institutes of Health or ‘NIH’] from 2012 to 2020 that appeared to include gain-of-function experiments… Funding from NIH for the 18 projects totaled about $48.8 million and unfolded at 13 institutions.” And,
From 2017 to 2020, no more than “three or four” projects were forwarded to the review committee, said Robert Kadlec, who oversaw the panel and served as the Trump administration’s assistant HHS [i.e., United States Department of Health and Human Services] secretary for preparedness and response. “They were grading their own homework,” Kadlec said.
In the expert opinion of the whistleblower Andrew Huff,
Several US-based scientists and US academic institutions received funding from numerous federal government agencies and private non-governmental organizations to complete the gain of function work on SARS-CoV-2. The work was completed domestically and abroad in partnership with several countries for sample collection, analysis, and laboratory work, including gain of function work, which was performed at Columbia University, the University of North Carolina, and at the Wuhan institute of virology, in China. (Andrew G. Huff, The Truth about Wuhan [Skyhorse Publishing, 2022], Chapter 16).
Unlike Huff, the FBI only blames China, alleging that covid-19 “most likely” originated from a lab incident in Wuhan.
In an interview with Sky News Australia on 27 November last year, Kadlec admitted that he downplayed the lab leak theory in order to gain cooperation from China in the early days of the outbreak. But he said, “I wake up at usually about 2 or 3 AM and think about it honestly, because it’s something that we all played a role in.” Speculating about Dr. Fauci’s motivation for diverting attention away from the Wuhan Institute of Virology, he guessed that Fauci was probably worried about his reputation, what would happen if people found out that “gain of function” research had resulted in an outbreak, saying, “That would be a natural reaction of him or anybody, particularly I think, for him saying, what could this do to me and to our institute as a consequence if we were found to have some culpability or some involvement in this?”
Experts on biodefense history, Jeanne Guillemin and the above whistleblower Andrew Huff, have downplayed the threat of bioweapons being used as a weapon of mass destruction (WMD) with statements such as the following:
1) “The rarity of actual use of biological weapons raises the question of their battlefield utility. Conventional weapons allow much more precision and immediate devastation.”
2) “Virtually all the major world powers have investigated the weapons potential of anthrax. Yet the most important fact to remember about all biological weapons (BW) is that they have almost never been used.”
3) “… a program was inaugurated to prepare 120 major U.S. cities for potential bioterrorist attack. Yet a review of domestic bioterrorism incidences in this century has shown that they have virtually never occurred…” (Jeanne Guillemin, “Soldiers’ Rights and Medical Risks: The Protest Against Universal Anthrax Vaccinations,” Human Rights Review 1:3 [2000] 130, 129, 132).
And more recently, in 2022, Andrew Huff wrote, “There is no tactical situation where [the use of bioweapons] will reach a desired goal, even from the perspective of a rational terrorist who seeks to obtain social dominance through fear, unless the person deploying them is a madman who is willing to kill all life, including their family and themselves.” (Huff, The Truth about Wuhan, Chapter 15, paragraph 16).
Probably the worst case of a bioweapon actually being used against Americans was the anthrax attacks of 2001, only a week after the 9/11 attacks. Letters with the deadly bacteria inside them were sent to members of Congress and the media. This terrified many people and brought a huge amount of money into the anthrax vaccine program. Profits and power flowed to Kadlec and others in biodefense.
Conclusion
Robert Kadlec’s career is just a microcosm, one tiny window through which we can peer into the dark, inner workings of the biodefense/biosecurity complex. In their book The COVID Consensus: The Global Assault on Democracy and the Poor—A Critique from the Left (2023), Thomas Fazi and Toby Green outline how public health policies that were aimed at protecting our health worsened poverty and made billionaires even wealthier. The COVID Consensus also emphasizes how women “lost massively,” through domestic abuse, prostitution, the poverty gap between men and women in the Global South, etc. (The COVID Consensus, “Introduction”). If it is true that the “worst form of violence is poverty,” as Gandhi said, then this should give us pause.
In 2021 Geoff Shullenberger wrote a thought-provoking essay entitled, “How We Forgot Foucault.” Michel Foucault (1926-84) used to be one of the most cited philosophers in the world. Shullenberger reminded people about one of Foucault’s main points, that the “logic of protecting life is a primary mode of legitimating violence on the part of the state.” Foucault pointed out that this logic of protecting life often provides an excuse for war as well as the death penalty.
With the perception of the threat of bioweapons, what we may be seeing now is a relatively new and clever way to create a state of exception. Decades ago, Foucault and Giorgio Agamben saw it coming. The military establishment can claim that our country is under attack by a virus. Whether it escaped accidentally from a biolab that aimed at protecting human health, or is a bioweapon (however unlikely that may be), or it was an accident of nature does not really matter from their perspective. What they need is our fear of the virus and our suspicion of those irresponsible voices who criticize the biosecurity industry and downplay the threat of the virus.
This was a lesson that we all could have learned after the anthrax attacks of 2001, in fact. In the aftermath of 2001, Agamben, who has to some extent followed in Foucault’s footsteps, “raised similar concerns about the post‑9/11 security state and the War on Terror. The demand for security at all costs, he argued then, can become the pretext for the imposition of a ‘state of exception’ in which laws and rights are indefinitely suspended.” Now might be a good time for Australians and Japanese to question the claim that they need their very own “DARPA” (Defense Advanced Research Projects Agency).
Theodor Rosebury, who was in charge of the Airborne Infection project at Fort Detrick, Maryland during World War II wrote a book entitled Peace or Pestilence? Biological Warfare and How to Avoid It (1949). His last words about the history of the institution for which he labored are telling:
Camp Detrick was born of fear. It now helps to generate more fear and is thereby itself regenerated. While fear remains Camp Detrick and its sister stations throughout the world must go on storing up destruction. If we had peace, these places could show us how to abolish influenza and the common cold, tuberculosis, malaria, and all the other natural plagues of man, as well as those of animals and plants. There is no reason to doubt that these things could be done; but first we must abolish the unnatural plague of war.
Australia and United Kingdom have committed to bilateral cooperation on improving digital online safety and security issues under a new intergovernmental agreement. The Memorandum of Understanding includes references to illegal content, child safety, age assurance, technology facilitated gender-based violence, and addressing harms caused by rapidly changing technologies like generative AI. Under the agreement, signed on…
“Every interaction between Black and Brown community members and CPD responding to a gunshot alert is dangerous. It puts people at risk of violence and harm,” says Stop ShotSpotter organizer Navi Heer. In this week’s episode of “Movement Memos,” host Kelly Hayes talks with two organizers from Chicago’s Stop ShotSpotter campaign, which claimed a major victory this week…
Federal government spending on R&D programs is expected to rise by almost $330 million this financial year, according to the latest Industry department figures, but science groups stress the need for a coordinated strategy to reverse a decades-long decline. Industry and Science minister Ed Husic on Thursday announced the release of the latest Science, Research,…
Companies rapidly embrace remote work and distributed teams to boost their adaptability and competitiveness in today’s fast-paced business environment. But this transition also introduces new hurdles, especially when protecting confidential information and systems. To tackle these issues effectively, businesses need to adopt a holistic strategy called Zero Trust.
This article guides you in managing a dispersed team securely by implementing zero-trust remote access solutions and robust remote access tools. Adhering to these recommendations allows businesses to enable remote work and strengthen their protection against possible cyber threats.
Understanding Zero Trust and remote access
Guided by the principle of “never trust, always verify,” Zero Trust Network Access (ZTNA) shifts from granting network access based on location to factors such as user identity, device health, and contextual information.
Zero Trust remote access solutions are the conduit enabling employees to connect with company resources beyond the corporate network and present opportunities and risks. While fostering flexibility in a distributed workforce, it demands secure implementation. Organisations must establish robust controls to safeguard sensitive information in the current landscape.
The synergy of Zero Trust remote access solutions and secure protocols fortifies security measures while facilitating productivity across locations. Adopting a ZTNA approach mitigates internal threats by restricting user access until proper authentication and verification occur.
Meanwhile, secure remote access protocols ensure encrypted connections, minimising interception risks. Regular policy reviews on remote access authentication methods and encryption standards are imperative to address emerging threats proactively.
Core Principles of Zero Trust Architecture for Remote Teams
Embarking on the journey of implementing a ZTNA architecture for remote teams demands a strategic adherence to fundamental principles ensuring the security of your distributed workforce.
Firstly, meticulous identity verification becomes paramount. Individuals seeking remote access to company resources must undergo accurate authentication through multi-factor authentication methods such as passwords, biometrics, and smart cards.
Secondly, access control is imperative. Once an individual’s identity is confirmed, access should be granted solely to the specific resources requisite for their job responsibilities. Implementing granular access controls is instrumental in conferring necessary permissions while minimising exposure to a sensitive data center.
Lastly, the bedrock principle of continuous monitoring is indispensable in zero-trust architecture. Constant vigilance of the entire network over user activity allows organisations to swiftly detect aberrations or deviations from standard patterns, signaling potential security threats.
By steadfastly adhering to these core principles, businesses can establish a remote work system that optimises productivity and fortifies layers of security essential in the contemporary digital landscape:
Step-by-step guide to implementing Zero Trust in your organisation
Begin by evaluating your current security infrastructure to identify vulnerabilities and gaps that require attention. This assessment is pivotal in gauging your organisation’s alignment with Zero Trust principles.
Develop a comprehensive zero-trust strategy outlining objectives, scope, and a timeline for implementing security service edge.
Clearly define roles and responsibilities for key stakeholders involved.
Identify and classify critical assets and sensitive data within your organisation.
Prioritise based on importance, sensitivity, and necessary access levels.
Enforce stringent user authentication protocols, incorporating multi-factor authentication (MFA) for remote users’ network or private apps access.
Mandate the use of strong, regularly updated passwords to enhance security.
Implement granular access controls, adhering to the principle of least privilege.
Regularly review and revoke unnecessary user privileges to minimise potential risks.
Deploy network segmentation to isolate segments based on data sensitivity. This practice limits lateral movement in case of a breach, preventing unauthorised access to critical resources.
Establish real-time monitoring capabilities using tools that detect anomalies or suspicious activities promptly. This ensures swift response to potential threats within the network environment.
Balancing security and usability in a Zero Trust environment
Effectively managing a distributed workforce in a Zero Trust, remote access environment demands a delicate equilibrium between security and usability. While prioritising a robust security posture, it’s equally pivotal not to impede productivity.
The implementation of multi-factor authentication (MFA) emerges as a formidable solution. Necessitating diverse forms of identification, passwords, and biometric data significantly curtail the risk of unauthorised access.
Routine updates of software and systems play a crucial role in promptly addressing vulnerabilities and ensuring optimal security without causing disruptions to user experience.
Clear guidelines for password management prove instrumental in promoting robust yet memorable password creation, thereby diminishing the risk of security breaches.
Striking this equilibrium between stringent security measures and user-friendly considerations allows organisations to cultivate a secure environment for their distributed workforce, fostering efficient collaboration and productivity.
Common challenges and solutions in Zero Trust adoption
One significant hurdle in adopting the Zero Trust remote access solutions approach is employees’ prevailing need for more awareness. The complex nature of Zero Trust and its implications for secure remote access often elude a comprehensive understanding.
Additionally, resistance to change poses another obstacle, particularly from employees comfortable with existing security practices. Overcoming skepticism and pushback requires a strategic shift in mindset.
Legacy systems further complicate matters, making it challenging for organisations to implement zero-trust principles seamlessly. Compatibility issues, outdated software, and limited resources hinder the adoption process.
Addressing these challenges demands a focused approach:
Employee education and training programs: Organisations should implement comprehensive training programs to enlighten employees about Zero Trust, its benefits, and its crucial role in ensuring secure remote access.
Change management strategies: Effectively managing resistance requires clear communication about the rationale behind Zero Trust adoption, addressing employee concerns openly, and providing support throughout the transition.
Gradual implementation plan: A gradual implementation plan allows for the incremental adoption of Zero Trust to accommodate organisations with legacy systems. This minimises disruptions and integrates new technologies smoothly into existing processes:
Case studies: successful Zero Trust deployment in distributed workforces
Addressing the worldwide issues brought about by the Covid-19 pandemic, Company Cimpress, a leading international tech corporation, promptly shifted its staff to work from home. The firm proactively embraced a zero-trust framework, which required rigorous verification processes for all workers before accessing any resources or applications. By establishing robust verification protocols and closely monitoring user activity, the Company Cimpress effectively limited access to only those authorised, reducing potential security risks. In the same vein,
Company Careem, a transportation business with employees across numerous countries, acknowledged the vital necessity of secure remote access. They adopted a zero-trust strategy and implemented multi-factor authentication (MFA) on all employee devices. This approach was further reinforced by stringent access controls and ongoing risk evaluations, ensuring customer data remained secure even in work-from-home situations.
Key takeaways from these initiatives underscore the effectiveness of a zero-trust architecture in securing distributed workforces. The pivotal role of solid authentication measures, exemplified by MFA, contributes significantly to the success of such deployments. Moreover, continuous monitoring of user behavior and periodic risk assessments emerge as imperative strategies for upholding network security in the evolving landscape of remote work.
The evolution of Zero Trust and remote work security
In today’s global workforce, remote work is pervasive, demanding robust security measures to protect data amid diverse access points. A pivotal framework gaining recognition is Zero Trust, departing from traditional models by advocating “never trust, always verify,” as discussed earlier. This mandates continuous authentication for users, devices, or applications accessing corporate resources.
Originating in 2010, Zero Trust’s practical importance surged with COVID-19-induced remote work. As organisations combat evolving cyber threats, adopting Zero Trust becomes imperative for secure internal network access. Transitioning involves multi-factor authentication, micro-segmentation for lateral movement constraints, and continuous monitoring tools. Adhering to these practices fortifies remote capabilities, safeguards sensitive data, and enhances defenses against breaches.
Australia’s green energy superpower ambition need a massive innovation and investment scheme to match, and will only be fully realised with a $100 billion a year carbon levy, according to policy experts Rod Sims and Ross Garnaut. The call to resurrect carbon pricing comes as the Albanese government finalises its response to the global competition…
To get to the Super Bowl on time, Taylor Swift took a private jet from Tokyo to Los Angeles and then hustled to Las Vegas. The carbon removal company Spiritus estimated that her journey of roughly 5,500 miles produced about 40 tons of carbon dioxide — about what is generated by charging nearly 5 million cell phones. But don’t worry, the company assured her critics: It would take those emissions right back out of the sky.
“Spiritus wants to help Taylor and her Swifties ‘Breathe’ without any CO2 ‘Bad Blood,’” it said in a pun-laden pitch to reporters. “It’s a touchdown for everyone.”
The startup is among dozens, if not hundreds, of businesses trying to permanently remove climate-warming gases from the atmosphere. Its approach involves drawing carbon directly from the air and burying it, but others sink it in the ocean. Last week, Graphyte, a venture backed by Bill Gates, began compacting sawdust and other woody waste that are rich in carbon into bricks that it will bury deep underground.
Spiritus says “sponsoring carbon offsets is a step toward environmental responsibility, not an endorsement of luxury flights” and added that “celebrities are going to take private jets regardless of what Spiritus does.” Even before the company stepped in, Swift reportedly planned to purchase offsets that more than covered her travel. But some climate experts say moves like Spiritus’ illustrate the dangerous direction the rapidly growing carbon dioxide removal, or CDR, industry is headed.
“The worry is that carbon removal will be something we do so that business-as-usual can continue,” said Sara Nawaz, director of research at American University’s Institute for Carbon Removal Law and Policy. “We need a really big conversation reframe.”
The United Nations Intergovernmental Panel on Climate Change says carbon removal will be “required” to meet climate targets, and the United States Department of Energy has a goal of bringing the cost down to $100 per ton (a price point Spiritus claims it wants to deliver as well). What concerns Nawaz is the outsize role that private companies are currently playing.
“It’s very market-oriented: doing carbon removals for profit,” Nawaz said. That reliance on the market, she elaborated, won’t necessarily lead to the just, equitable, and scalable outcomes that she hopes CDR can achieve. “We need to take a step back.”
Nawaz co-wrote a report released today titled “Agenda for a Progressive Political Economy of Carbon Removal.” In it, she and her co-authors lay out a vision for carbon removal that shifts away from market-centric approaches to ones that are government-, community-, and worker-led.
“What they suggest is quite radical,” said Lauren Gifford, associate director of the Soil Carbon Solutions Center at Colorado State University who was not involved in the research. She supports the direction the authors advocate, adding, “They actually give us a roadmap on how to get there, and that in itself is progressive.”
Nawaz compared carbon removal’s current trajectory to the bumpy path that carbon offsets has followed. That industry, in which organizations sell credits to offset greenhouse gas emissions, has been plagued by misleading claims and perverse incentives. It has also raised environmental justice concerns where offsets are disproportionately impacting frontline communities and developing nations. For example, Blue Carbon, a company backed by the United Arab Emirates, has been buying enormous swaths of land in Africa to fuel its offsets program.
“We don’t want to do that again with carbon removal,” she said.
Philanthropy is one possible alternative to corporate carbon removal. The report cites a nonprofit organization called Terraset that puts tax-deductible donations toward CDR projects (including Spiritus’). But, Nawaz says, that approach won’t grow quickly or sustainably enough to remove the many gigatons of emissions needed to meaningfully address climate change.
“That’s not a scalable approach,” she said. “We’re going to need so much more money.”
The report argues that communities and governments must play a central role in the industry. Nawaz cites community-driven carbon removal efforts out West, such as the 4 Corners Carbon Coalition, as examples of what might be possible on the local level. Nationally, she points to Germany’s transition away from coal as a way that governments can not only fund but fundamentally drive clean energy policy that puts workers at the fore.
To be sure, the United States is investing in carbon removal. The bipartisan infrastructure law and Inflation Reduction Act included billions of dollars for technology such as regional direct air capture hubs. But the legislation mostly positions the government as a funder or purchaser of carbon removal initiatives rather than a practitioner.
“It’s, frankly, a pretty disappointing way it’s evolving,” said Nawaz, noting, for instance, that Occidental Petroleum is among those receiving federal funding for carbon removal. She would like to see the government take a more hands-on role. “Not just government procurement of carbon removal. But actually government-led research and early-stage implementation of carbon removal.”
Gifford agrees that there are dangers in the industry relying too much on the private sector. “There’s something really scary about putting the climate crisis in the hands of wealthy tech founders,” she said. But companies have also been at the forefront of advancing the field as well. “The climate crisis is one of these things that’s all-hands-on-deck.”
Those in the private sector say their efforts are critical to ensuring that carbon removal technology is developed and deployed as quickly as possible. “Our coalition represents innovators,” said Ben Rubin, the executive director of the Carbon Business Council, a nonprofit trade association representing more than 100 carbon management companies. ”There won’t necessarily be one silver bullet.”
“There’s a long history of public-private partnerships ushering in some of the world’s latest and greatest innovations,” added Dana Jacobs, the chief of staff for the Carbon Removal Alliance, which similarly represents startups in this space. “We think carbon removal won’t be any different.”
Nawaz and her colleagues want to shake that paradigm before it’s too deeply entrenched. The alternative could be continued unjust outcomes for marginalized people and limited progress on luxury emissions, such as Swift’s flight to the Super Bowl.
“The idea is that carbon removal is a public good,” she said. “We shouldn’t have to rely on just the private sector to provide it.”
The University of the South Pacific journalism programme is hosting a cohort student journalists from Australia’s Queensland University of Technology this week.
Led by Professor Angela Romano, the 12 students are covering news assignments in Fiji as part of their working trip.
The visitors were given a briefing by USP journalism teaching staff — Associate Professor in Pacific journalism and programme head Dr Shailendra Singh, and student training newspaper supervising editor-in-chief Monika Singh.
The students held lively discussions about the form and state of the media in Fiji and the Pacific, the historic influence of Australian and Western news media and its pros and cons, and the impact of the emergence of China on the Pacific media scene.
Dr Singh said the small and micro-Pacific media systems were “still reeling” from revenue loss due to digital disruption and the covid-19 pandemic.
As elsewhere in the world, the “rivers of gold” (classified advertising revenue) had virtually dried up and media in the Pacific were apparently struggling like never before.
Dr Singh said that this was evident from the reduced size of some newspapers in the Pacific, in both classified and display advertising, which had migrated to social media platforms.
Repeal of draconian law
He praised Fiji’s coalition government for repealing the country’s draconian Media Industry Development Act last year, and reviving media self-regulation under the revamped Fiji Media Council.
However, Dr Singh added that there was still some way to go to further improve the media landscape, including focus on training and development and working conditions.
“There are major, longstanding challenges in small and micro-Pacific media systems due to small audiences, and marginal profits,” he said. “This makes capital investment and staff development difficult to achieve.”
The QUT students are in Suva this month on a working trip in which students will engage in meetings, interviews and production of journalism. They will meet non-government organisations that have a strong focus on women/gender in development, democracy or peace work.
The students will also visit different media organisations based in Suva and talk to their female journalists on their experiences and their stories.
The USP journalism programme started in Suva in 1988 and it has produced more than 200 graduates serving the Pacific and beyond in various media and communication roles.
The programme has forged partnerships with leading media players in the Pacific and our graduates are shining examples in the fields of journalism, public relations and government/NGO communication.
Asia Pacific Report publishes in partnership with The University of the South Pacific’s newspaper and online Wansolwara News.
Facebook and Instagram’s parent company, Meta, is contemplating stricter rules around discussing Israeli nationalism on its platforms, a major policy change that could stifle criticism and free expression about the war in Gaza and beyond, five civil society sources who were briefed on the potential change told The Intercept.
“Meta is currently revisiting its hate speech policy, specifically in relation to the term ‘Zionist,’” reads a January 30 email sent to civil society groups by Meta policy personnel and reviewed by The Intercept. While the email says Meta has not made a final determination, it is soliciting feedback on a potential policy change from civil society and digital rights groups, according to the sources. The email notes that “Meta is reviewing this policy in light of content that users and stakeholders have recently reported” but does not detail the content in question or name any stakeholders.
“As an anti-Zionist Jewish organization for Palestinian freedom, we are horrified to learn that Meta is considering expanding when they treat ‘Zionism’ — a political ideology — as the same as ‘Jew/Jewish’ — an ethno-religious identity,” said Dani Noble, an organizer with Jewish Voice for Peace, one of the groups Meta has contacted to discuss the possible change. Noble added that such a policy shift “will result in shielding the Israeli government from accountability for its policies and actions that violate Palestinian human rights.”
For years, Meta has allowed its 3 billion users around the world to employ the term “Zionist,” which refers to supporters of the historical movement to create a Jewish state in the Middle East, as well as backers of modern-day nationalism in support of that state and its policies.
Meta’s internal rules around the word “Zionist,” first reported by The Intercept in 2021, show that company moderators are only supposed to delete posts using the term if it’s determined to be a proxy for “Jewish” or “Israeli,” both protected classes under company speech rules. The policy change Meta is now considering would enable the platform’s moderators to more aggressively and expansively enforce this rule, a move that could dramatically increase deletions of posts critical of Israeli nationalism.
“We don’t allow people to attack others based on their protected characteristics, such as their nationality or religion. Enforcing this policy requires an understanding of how people use language to reference those characteristics,” Meta spokesperson Corey Chambliss told The Intercept. “While the term Zionist often refers to a person’s ideology, which is not a protected characteristic, it can also be used to refer to Jewish or Israeli people. Given the increase in polarized public discourse due to events in the Middle East, we believe it’s important to assess our guidance for reviewing posts that use the term Zionist.”
In the months since October 7, staunchly pro-Israel groups like the Anti-Defamation League have openly called for treating anti-Zionism as a form of antisemitism, pointing out that the word is often used by antisemites as a stand-in for “Jew.” The ADL and American Jewish Committee, another pro-Israel, Zionist advocacy group in the U.S., have both been lobbying Meta to restrict use of the word “Zionist,” according to Yasmine Taeb, legislative and political director at the Muslim grassroots advocacy group MPower Change. In his statement, Chambliss responded, “We did not initiate this policy development at the behest of any outside group.”
Taeb, who spoke to a Meta employee closely involved with the proposed policy change, said it would result in mass censorship of critical mentions of Zionism, restricting, for example, non-hateful, non-violent speech about the ongoing bloodshed in Gaza.
While a statement as general as “I don’t like Zionists” could be uttered by an antisemitic Instagram user as a means of expressing dislike for Jews, civil society advocates point out that there is nothing inherently or necessarily anti-Jewish about the statement. Indeed, much of the fiercest political activism against Israel’s war in Gaza has been organized by anti-Zionist Jews, while American evangelical Christian Zionists are some of Israel’s most hardcore supporters.
“The suppression of pro-Palestinian speech critical of Israel is happening specifically during the genocide in Gaza,” Taeb said in an interview. “Meta should instead be working on implementing policies to make sure political speech is not being suppressed, and they’re doing the exact opposite.”
According to presentation materials reviewed by The Intercept, Meta has been sharing with stakeholders a series of hypothetical posts that could be deleted under a stricter policy, and soliciting feedback as to whether they should be. While one example seemed like a clear case of conspiratorial antisemitic tropes about Jewish control of the news media, others were critical of Israeli state policy or supporters of that policy, not Judaism, said Nadim Nashif, executive director of the Palestinian digital rights group 7amleh, who was briefed this week by Meta via video conference. Meta plans to brief U.S. stakeholder groups on Friday morning, according to its outreach email.
Examples of posts Meta could censor under a new policy included the statements: “Zionists are war criminals, just look at what’s happening in Gaza”; “I don’t like Zionists”; and “No Zionists allowed at tonight’s meeting of the Progressive Student Association.” Nashif said that one example — “Just read the news every day. A coalition of Zionists, Americans and Europeans tries to rule the world.” — was described by Peter Stern, Meta’s director of content policy stakeholder engagement, as possibly hateful because it engaged in conspiratorial thinking about Jews.
In an interview with The Intercept, Nashif disagreed, arguing that criticism of the strategic alliance and foreign policy alignment between the U.S., European states, and Israel should not be conflated with conspiratorial bigotry against Judaism, or collapsed into bigoted delusions of global Jewish influence. In their meeting, Nashif says Stern acknowledged that Zionism is a political ideology, not an ethnic group, despite the prospect of enforcement that would treat it more like the latter. “I think it may actually harm the fight against antisemitism, conflating Zionism and the Israeli government with Judaism,” Nashif told The Intercept.
It will be difficult or impossible to determine whether someone says they “don’t like” Zionists with a hateful intent, Nashif said, adding: “You’d need telepathy.” Meta has yet to share with those it has briefed any kind of general principles, rules, or definitions that would guide this revised policy or help moderators enforce it, Nashif said. But given the company’s systematic censorship of Palestinian and other Arab users of its platforms, Nashif and others familiar with the potential change fear it would make free expression in the Arab world even more perilous.
“As anti-Zionist Jews, we have seen how the Israeli government and its supporters have pushed an agenda that falsely claims that equating ‘Zionist’ with ‘Jew’ or ‘Jewish’ will somehow keep Jews safe,” added Noble of Jewish Voice for Peace. “Not only does conflating anti-Zionism and antisemitism harm all people who fight for human rights in the world by stifling legitimate criticism of a state and military, it also does nothing to actually keep our community safe while undermining our collective efforts to dismantle real antisemitism and all forms of racism, extremism and oppression.”
In 2021, when China banned bitcoin and other cryptocurrencies, crypto miners flocked to the United States in search of cheap electricity and looser regulations. In a few short years, the U.S.’s share of global crypto mining operations grew from 3.5 percent to 38 percent, forming the world’s largest crypto mining industry.
The impacts of this shift have not gone unnoticed. From New York to Kentucky to Texas, crypto mining warehouses have vastly increased local electricity demand to power their 24/7 computing operations. Their power use has stressed local grids, raised electricity bills for nearby residents, and kept once-defunct fossil fuel plants running. Yet to date, no one knows exactly how much electricity the U.S. crypto mining industry uses.
That’s about to change as federal officials launch the first comprehensive effort to collect data on cryptocurrency mining’s energy use. This week, the U.S. Energy Information Administration, an energy statistics arm of the federal Department of Energy, is requiring 82 commercial crypto miners to report how much energy they’re consuming. It’s the first survey in a new program aiming to shed light on an opaque industry by leveraging the agency’s unique authority to mandate energy use disclosure from large companies.
“This is nonpartisan data that’s collected from the miners themselves that no one else has,” said Mandy DeRoche, deputy managing attorney in the clean energy program at the environmental law nonprofit Earthjustice. “Understanding this data is the first step to understanding what we can do next.”
Cryptocurrencies like bitcoin bypass the need for financial institutions by adding data to a public ledger, or “blockchain,” to verify all transactions. To win money, computers using energy-intensive mining software race to confirm additions to the blockchain. According to initial estimates published by the U.S. Energy Information Administration last week, cryptocurrency mining could account for between 0.6 percent and 2.3 percent of total annual U.S. electricity use. To put that into perspective, in 2022, the entire state of Utah consumed about 0.8 percent of electricity consumed in the U.S. The state of Washington, home to nearly 8 million people, consumed 2.3 percent.
“It’s a tremendous amount of energy that we don’t have transparency into and that we don’t understand the details about,” DeRoche told Grist. One reason why it’s so difficult to track crypto mining’s energy use is the size of mining facilities, which can range from individual computers to giant warehouses. Smaller facilities are often exempt from local permitting requirements and frequently move to source cheaper electricity. Data on larger operations’ energy use is often hidden in private contracts with local utilities or tied up in litigation over individual facilities, said DeRoche.
The Energy Information Administration, or EIA, is in an unusually powerful position to require greater transparency from crypto miners. Under federal law, the agency can require any company engaged in “major energy consumption” to provide information on its power use. In July 2022 and February 2023, Democratic members of Congress including Senator Elizabeth Warren and Representative Rashida Tlaib sent letters to the Environmental Protection Agency and the Department of Energy, calling for the agencies to exercise that authority over crypto miners and “implement a mandatory disclosure regime as rapidly as possible.”
In late January, the EIA sent a letter to the White House Office of Management and Budget requesting emergency approval to survey crypto mining facilities, taking the first step in creating such a regime. The letter raised concerns that the price of bitcoin had increased 50 percent in the last three months, incentivizing more mining activity that could stress local power grids already under strain from cold weather and winter storms.
“Given the emerging and rapidly changing nature of this issue and because we cannot quantitatively assess the likelihood of public harm, we feel a sense of urgency to generate credible data that would provide insight into this unfolding issue,” EIA Administrator Joseph DeCarolis wrote in the letter. The White House approved the survey on January 26.
While its total electricity use is poorly understood, cryptocurrency mining’s impacts on utility bills and carbon pollution have been widely documented. A recent analysis by the energy consulting firm Wood Mackenzie found that bitcoin mining in Texas has already raised electricity costs for residents by $1.8 billion per year. In the winter of 2018, utility bills for residents in Plattsburgh, New York, rose by up to $300 as nearby bitcoin miners gobbled up low-cost hydropower, forcing the city to buy more expensive electricity elsewhere.
Crypto’s skyrocketing electricity demand has also revived previously shuttered fossil fuel power generators. Near Dresden, New York, the formerly shut-down Greenidge natural gas plant reopened in 2017 exclusively to power bitcoin mining. In Indiana, a coal-fired plant slated to power down in 2023 will now keep operating, and a crypto mining facility is setting up shop next door. AboutBit, the crypto mining startup that owns the facility, told the Indianapolis outlet IndyStar that the facility had nothing to do with the coal plant remaining open. DeRoche pointed to other gas plants in New York and Kentucky where crypto mining operations have created renewed demand for fossil fuels.
The Greenidge Generation bitcoin mining facility by Seneca Lake near Dresden, New York, in 2021. Ted Shaffrey / AP Photo
In Texas, crypto miners are also paid by the state’s power grid operator to shut down during heat waves and other periods of high demand. Since 2020, five facilities in Texas have made at least $60 million from the program, according to The New York Times. Those subsidies come without much payoff or jobs for local residents, DeRoche said: Even large mining operations employ at most only a few dozen people, the Times reported.
Bitcoin mining companies, however, maintain that they benefit local residents. Riot Platforms, one of the country’s biggest bitcoin mining firms, stated in a press release in September that the company “employs hundreds of Texans and is helping to revitalize communities that had experienced economic hardship.” Crypto mining businesses also dispute claims that they overuse energy resources. In a May 2022 letter to the Environmental Protection Agency, the Bitcoin Mining Council, a group representing bitcoin mining companies, made the dubious claim that “Bitcoin miners have no emissions whatsoever.” The group added, “Digital asset miners simply buy electricity that is made available to them on the open market, just the same as any industrial buyer.”
Policymakers are finally starting to catch up to the industry’s impacts on the climate and neighboring communities. In November 2022, the state of New York enacted a two-year moratorium on new crypto mining facilities that source power from fossil fuel plants.
The EIA’s surveys of crypto mining companies beginning this week will identify “the sources of electricity used to meet cryptocurrency mining demand,” DeCarolis, the EIA administrator, said in a press release. The data will be published on the EIA’s website later this year.
In the dynamic world of casinos, technological advancements have revolutionised the way transactions are conducted, enhancing convenience, security and overall player experience. From the integration of blockchain technology to the adoption of sophisticated data analytics, casinos are leveraging technology to streamline operations and meet the evolving needs of players and operators alike.
Convenience redefined: digital payment solutions and mobile apps
Gone are the days of cumbersome cash transactions and long queues at the cashier’s window. The emergence of digital payment solutions and mobile apps, as seen on Sportslens UK, has simplified the process of funding accounts and withdrawing winnings. Players can now enjoy their favorite casino games from the comfort of their homes or on the go, with transactions completed seamlessly and securely at the touch of a button.
Blockchain technology: ensuring transparency and security
Blockchain technology has emerged as a game-changer in the world of casino transactions. With its decentralised ledger system, blockchain ensures transparency, security and immutability for every transaction. According to industry reports, blockchain-based casinos offer unparalleled transparency, enabling players to verify the fairness of games and the integrity of payouts in real-time, with a 95% increase in player trust observed in blockchain-powered platforms. Moreover, blockchain enables near-instantaneous transactions, eliminating processing times and reducing transaction fees by up to 70% compared to traditional banking methods, as reported by leading financial analysts.
Personalisation through data analytics and artificial intelligence
Casinos are harnessing the power of data analytics and artificial intelligence to better understand player behavior and preferences. By analysing vast amounts of data collected from player interactions, casinos can personalise their offerings and tailor promotional campaigns to individual players. AI-powered algorithms identify patterns in gameplay and recommend personalised bonuses or rewards based on a player’s betting history and preferences, enhancing customer satisfaction and loyalty.
Enhancing security: biometric authentication and cryptocurrency
In an age of increasing cyber threats and data breaches, casinos are implementing advanced security measures to protect player accounts and financial information. Biometric authentication systems, such as fingerprint and facial recognition technology, verify the identity of players and prevent fraudulent activity. Additionally, the adoption of cryptocurrencies like Bitcoin and Ethereum offers players a secure and anonymous payment method, with lower transaction fees and faster processing times compared to traditional banking channels.
Enhanced customer support: chatbots and virtual assistants
The integration of chatbots and virtual assistants has revolutionised customer support in the casino industry. These AI-powered tools provide instant assistance to players, answering questions, resolving issues and providing personalised recommendations. With 24/7 availability and multilingual support, chatbots and virtual assistants enhance the overall player experience, ensuring that players receive prompt and efficient assistance whenever they need it.
Streamlined account verification processes
Account verification is a crucial aspect of casino transactions, ensuring compliance with regulatory requirements and preventing fraudulent activity. Technological innovations, such as automated identity verification systems, streamline the verification process, allowing players to onboard quickly and start playing without unnecessary delays. These systems utilise advanced algorithms and machine learning to verify player identities accurately and securely, providing a seamless and hassle-free registration experience.
Efficient payment processing systems
Efficient payment processing systems are essential for ensuring smooth and timely transactions in the casino industry. Advanced payment gateways and processing platforms facilitate secure deposits and withdrawals, supporting a wide range of payment methods, including credit cards, e-wallets and bank transfers. With robust fraud detection mechanisms and real-time transaction monitoring, these systems minimise the risk of payment fraud and unauthorised transactions, providing players with peace of mind and confidence in the integrity of their financial transactions.
Regulatory compliance and responsible gaming measures
The casino industry is subject to stringent regulatory requirements aimed at ensuring fairness, transparency and responsible gaming practices. Technology plays a crucial role in helping casinos comply with these regulations and promote responsible gambling behavior among players. Automated compliance solutions monitor player activity in real-time, flagging suspicious behavior and identifying potential signs of problem gambling. By implementing responsible gaming measures and promoting player education, casinos can create a safer and more sustainable gaming environment for all players.
Continuous innovation and adaptation
In an ever-evolving industry, continuous innovation and adaptation are key to staying ahead of the curve. Casinos must embrace emerging technologies and trends, such as virtual reality gaming, augmented reality experiences and immersive storytelling, to enhance the overall gaming experience and attract new audiences. By investing in research and development, collaborating with technology partners and fostering a culture of innovation, casinos can remain at the forefront of technological advancements and continue to provide players with unforgettable gaming experiences for years to come.
The wrap up
Technology has reshaped the landscape of casino transactions, offering unparalleled convenience, security and innovation. From blockchain-powered casinos to AI-driven analytics and biometric authentication systems, the future of gaming is brighter and more exciting than ever before. As technology continues to evolve, players can expect a gaming experience that is more immersive, personalised and rewarding than ever before.
The art form that was once a way to spend some time in the evening. People used to have skills in figuring out the cards, and the combinations, and spent hours in the maze. Accessibility creates a market. When it is an easy thing, the interest subsides. Gambling turns into a bad dream in the unfortunate situation that you don’t end up winning anything at all. Because the house always has the edge, you can enjoy slim luck, based on whatever RTP the game reports. It seldom takes time to feel the urge to make that one more spin, in the hope of hitting the jackpot or at least the lucky combination. Asking oneself to not get used to this is a big deal. Let us learn why there is a rise in the numbers in this short article.
What is self-exclusion?
Whenever you are in a casino or playing on your smartphone you may notice the responsible gambling settings. It was made mandatory by gambling authorities that regulate this business to put forth security measures that can reduce losses for the company, as well as for the user. When a player is in a compulsive state and is unable to repay the operator, it makes sense to disqualify the player from the platform. It is the same as checking one out of a casino for non-payment. This is the definition of exclusion, but if one does it voluntarily, it is self-exclusion.
Thus, self-exclusion is the practice of stopping yourself from doing something. For example, controlling your hunger for fast food or buying discounted products and so on. If we learn to self-exclude, we can combat the addictive spirit of gambling. However, it’s worth noting that for those who may want to return to gambling in the future, alternative online casinos that are not in GamStop provides a perfect way to do so. But it is still important to maintain control over their gaming habits responsibly.
How does it work?
To understand something better, one must practice it. In the context of gambling, you don’t need to do even that. If you have a single account online on any online casino platform, you will find these responsible gambling settings in your main account. To implement them on your profile, just go to the settings tab, check the self-exclusion tab and you will find several more options. Some casinos may have more or less depending on the website design.
First, you log in and create your online account.
You must fill up these settings before you begin your first bet. This is generally the condition for eligibility as well.
You have to set limits on deposits, withdrawals, number of losses, loss of money, budget, number of spins, time of play, and so on.
If a person exceeds certain limits, they will be logged out of the platform automatically.
There is also a period for which they cannot access their account that they have to self-specify when creating the account.
Further, one cannot just say “Nil” or “Zero” or “Never” and so on, because these are against the rules.
There are other ways too where online casinos help people get rid of this behaviour. The compulsion to keep playing despite losses. They offer insights and help through various organisations like GamStop to help the needy. If you want to self-exclude, you can seek their consultation as well. Often, they are free.
Factors driving the fast increase
The rise in the numbers can be due to many reasons, some of which we elaborate here.
There is a general awareness of responsible gambling policies and their benefits for players. This allows oneself to think twice.
When the pandemic was closing all businesses, online markets grew and people spent most of their time on the web. But, now that is not necessary anymore.
Many regulatory bodies are forcing gambling sites to spread awareness and focus on players’ health rather than just profits.
The inclusion of responsible gambling tools like GamStop is on the rise and is actively promoted by many casinos. Additionally, there has been a noticeable increase in the availability of betting operators without GamStop, providing players with more options for managing their gambling habits responsibly.
Effects on the gambling industry
It is a direct result of the rise in exclusions that casinos will get lesser traffic. While businesses want to make profits, accountability, and laws force them to stop taking advantage of players who have a gambling addiction. This affects the companies in two major ways.
One is a decrease in revenue because of fewer users. Even though they don’t need to maintain physical stores, there are costs for online keep-up too.
They are also forced to make marketing strategies to bring in new users to make up for the lost ones.
The importance of self-exclusion
There are two major benefits for the players.
They can become aware of their health, and responsibility towards gambling.
They understand the importance of the addictive nature, and programs like GamStop can help them or others who are unable to cope themselves.
Support and resources
Online casinos list these resources in their information pages. GamStop, BeGambleAware, GamCare, and other external assistance are a few names. They provide confidential help and offer you the chance to restrict your online activities. The prevention services are often free of charge as well.
Conclusion
The significance of trying to control yourself from going over the budget or coming back every day to bet some more is big. Players and their friends who know them should advise them on this. Being responsible when gambling is a must and because of that all casinos mandate everyone to be adult and above. Fun and winning money is alright but gambling is never a source of regular income.
The Tories are still “ducking the issue” of regulating to protect workers in the face of AI. that’s the verdict of the Trades Union Congress (TUC), as the government released its response to a White Paper consultation on the issue. Clearly, Rishi Sunak would fail the test of Isaac Asimov’s Three Laws of Robotics – as the PM appears hellbent on defending AI over actual humans.
AI: Tories say blah, blah, blah
As Computer Weekly reported, the government ran a public consultation on its White Paper proposals over regulating AI last year. This included:
“pro-innovation” proposals for regulating AI, which revolve around empowering existing regulators to create tailored, context-specific rules that suit the ways the technology is being used in the sectors they scrutinise.
It also outlined five principles that regulators must consider to facilitate “the safe and innovative use of AI” in their industries, and generally built on the approach set out by government in its September 2021 national AI strategy which sought to drive corporate adoption of the technology, boost skills and attract more international investment.
There were hundreds of submissions to the consultation. Now, the government has responded. Computer Weekly noted that:
the government generally reaffirmed its commitment to the whitepaper’s proposals, claiming this approach to regulation will ensure the UK remains more agile than “competitor nations” while also putting it on course to be a leader in safe, responsible AI innovation.
“The technology is rapidly developing, and the risks and most appropriate mitigations, are still not fully understood,” said the Department of Science, Innovation and Technology (DSIT) in a press release.
“The UK government will not rush to legislate, or risk implementing ‘quick-fix’ rules that would soon become outdated or ineffective. Instead, the government’s context-based approach means existing regulators are empowered to address AI risks in a targeted way.”
However, there was a gaping hole in the government’s response. It put forward little-to-nothing on regulations to protect workers’ rights over that of AI. So, the TUC has hit back.
‘Leaving workers at risk of exploitation and discrimination’
TUC General Secretary Paul Nowak said:
AI is already make life-changing decisions about the way we work – like how people are hired, performance-managed and even fired. That’s why we need employment-specific legislation to ensure AI is used fairly in the workplace.
But the government is still ducking this issue by refusing to pass new laws and to give workers and business the certainty they need. A minimalist approach to regulating AI is not going cut it. It will just leave many at risk of exploitation and discrimination.
Commenting on the need to involve unions in AI policy-making after the government excluded them from November 2023’s AI Summit, Nowak added:
Working people must be given a seat at the table.
In America’s unions have been put at the heart of AI policy-making. But in the UK unions have been marginalised along with broader civil society.
Over on X, people were also critical. An interesting thread is below:
The government has finally published its response to the AI White Paper consultation, and it’s still lacking any practical steps to get AI under democratic control. Here are my hot takes.https://t.co/qXDcWqi0h2
So, the TUC is taking matters into its own hands. In September it launched a new AI taskforce to safeguard workers’ rights and to ensure the technology benefits all. The taskforce has brought together leading specialists in law, technology, politics, HR and the voluntary sector. It will publish an expert-drafted AI and Employment Bill this year and will lobby to have it incorporated into UK law.
It’s unsurprising that the Tories are putting the interests of big tech over that of workers. So, in reality their approach is less Asimov – and more Skynet. Or maybe Sunak is actually an Agent Smith:
In 1862, the Morrill Act allowed the federal government to expropriate over 10 million acres of tribal lands from Native communities, selling or developing them in order to fund public colleges. Over time, additional violence-backed treaties and land seizures ceded even more Indigenous lands to these “land-grant universities,” which continue to profit from these parcels.
But the Morrill Act is only one piece of legislation that connects land taken from Indigenous communities to land-grant universities. Over the past year, Grist looked at state trust lands, which are held and managed by state agencies for the schools’ continued benefit, and which total more than 500 million surface and subsurface acres across 21 states. We wanted to know how these acres, also stolen Indigenous land, are being used to fund higher education.
To do this, we needed to construct an original dataset.
Gristlocated all state trust lands distributed through state enabling acts that currently send revenue to higher education institutions that also benefited from the Morrill Act.
We identified their original Indigenous inhabitants and caretakers, and researched how much the United States would have paid for each parcel. The latter is based on an assessment of Indigenous territorial history, according to the U.S. Forest Service, associated with the land the parcels are on.
We reconstructed more than 8.2 million acres of state trust parcels taken from 123 tribes, bands, and communities through 121 land cessions, a legal term for the surrendering of land. (It is important to note that land cession histories are incomplete and accurate only to the view of U.S. law and historical negotiations, not to Indigenous histories, epistemologies, or historic territories not captured by federal data.)
This unique dataset was created through extensive spatial analysis that acquired, cleaned, and analyzed data from state repositories and departments across more than 14 states. We also reviewed historical financial records to supplement the dataset.
This information represents a snapshot of trust land parcels and activity present in November 2023. We encourage exploration of the database and caution that this snapshot is likely very different from state inventories 20, 50, or even 100 years ago. Since, to our knowledge, no other database of this kind exists — with this specific state trust land data benefitting land-grant universities — we are committed to making it publicly available and as robust as possible.
To identify what types of activities take place on state trust land parcels, we collected and compared state datasets on different kinds of land use. The activities in these data layers include, but are not limited to: active and inactive leases for coal, oil and gas, minerals, agriculture, grazing, commercial use, real estate, water, renewable energies, and easements. We then conducted spatial comparisons between these layers, explained further in Step 5 (see index below).
Users can also go to GitHub to view and download the code used to generate this dataset. The various functions used within the program can also be adapted and repurposed for analyzing other kinds of state trust lands — for example, those that send revenue to penitentiaries and detention centers, which a number of states do.
If you republish this data or draw on it as a source for publication, cite as: Parazo Rose, Maria, et al. “Enabling Act Indigenous Land Parcels Database,” Grist.org, February 2024.
STL Parcel: State trust land parcels, or land granted to states through enabling acts. The word “parcel” refers to defined pieces of land that can range in size and are considered distinct units of property.
PLSS Number: The surveying method developed and used in the United States to plat, or divide, real property for sale and settling.
CRS System: A coordinate reference system that defines how a map projection in a GIS program relates to and represents real places on Earth. Deciding what CRS to use depends on the regional area of analysis.
Dataframe: A dataframe is a “two-dimensional” way of storing and manipulating tabular data, similar to a table with columns and rows.
REST API: An API, or application programming interface, is a type of software interface that allows users to communicate with a computer or system to retrieve information or perform a function. REST, also known as RESTful web services, stands for “representational state transfer” and has specific constraints. Systems with REST APIs optimize client-server interactions and can be scaled up efficiently.
Deduplication: Deduplication refers to a method of eliminating a dataset’s redundant data. In a secure data deduplication process, a deduplication assessment tool identifies extra copies of data and deletes them, so a single instance can then be stored. In our methodology, we deduplicated extra parcels, which we explain in further detail in Step 4.
To reconstruct the redistribution of Indigenous lands and the comparative implications of their conversion to revenue for land-grant universities, we followed procedures that can be generally categorized in seven steps:
We identified 14 universities in 14 states that initially benefited from the Morrill Act of 1862 and currently receive revenue benefits from state trust lands granted through enabling acts.
Initially, 30 states distributed funds to higher education institutions, including land-grant universities, according to their enabling acts. We contacted all 30 states via phone and email to confirm whether they had state trust lands that currently benefitted target institutions. Multiple states continue to distribute revenue generated from state trust lands to other higher education institutions, as well as K-12 schools. However, those states are not included in our dataset as the lands in question are outside the scope of this investigation.
In other words, multiple states have trust lands that produce revenue for institutions, but only 14 have trust lands that produce revenue for land-grant universities.
Data acquisition
Once we clarified which states had relevant STL parcels, the next step was to acquire the raw data of all state trust lands within that state so we could then filter for the parcels associated with land-grant institutions. We started by searching state databases, typically associated with their departments of natural resources, or the equivalent, to find data sources or maps. While most of the target states maintain online spatial data on land use and ownership, not all of that data is immediately available to download or access. For several states, we were able to scrape their online mapping platforms to access their REST servers and then query data through a REST API. For other states, we directly contacted their land management offices to get the most up-to-date information on STL parcels.
(Please see Table 1 for a list of the data sources referenced for each state, as well as all state-specific querying details.)
After acquiring the raw data, we researched which trust names were associated with the 14 identified universities. As mentioned above, each state maintains trust lands for multiple entities ranging from K-12 schools to penitentiaries, and each state has unique names for target beneficiaries in their mapping and financial data. We used these trust names to manually filter through the raw data and select only the parcels that currently send revenue to university beneficiaries and checked those names with state officials for accuracy.
Once identified and filtered, we reviewed that raw data to identify whether there were any additional fields that would be helpful to our schema (typically locational data of some kind, like PLSS, though this occasionally included activity or lease information) and included those fields as part of the data we extracted from state servers or the spatial files we were given, in addition to the geometric data that located and mapped the parcels themselves.
It’s important to note that we could not find information for 871 surface acres and 5,982 subsubsurface acres in Oklahoma, because they have yet to be digitally mapped or because of how they are sectioned on the land grid. We understand that this acreage does exist based on lists of activities kept by the state. However, those lists do not provide mappable data to fill these gaps. In order to complete reporting on Oklahoma, researchers will need to read and digitize physical maps and plats held by the state — labor this team was unable to provide during the project period.
Please also note that our dataset is partially incomplete due to the Montana Department of Natural Resources & Conservation’s delay in responding to a public records request by the time of publication. In the summer of 2023, we requested a complete dataset of state trust lands that send revenue to Montana State University. However, when we conducted a data review fact check with the Montana DNR this winter, they informed us that the data they supplied was incomplete and thus, inaccurate. We currently have a pending public records request that has yet to be returned.
(Please see Appendix A for specific notes on the data processing for OK.)
Data cleaning
When working with this data, one of the main considerations was that nearly all the data sources came in different and incompatible formats: The coordinate reference systems, or CRS, varied and had to be reprojected, the references to the trust names were inconsistent, and some files contained helpful fields, like location-specific identifiers or land use activity, while others were missing entire categories of information. Once we narrowed down the data we wanted, we cleaned and standardized the data, and sorted it into a common set of column names. This was particularly difficult for two states, Oklahoma and South Dakota, which required custom processing based on the format and quality of the initial data provided.
(Please see Appendix A for specific descriptions of the data processing for OK and SD.)
This process required a significant amount of state-specific formatting. This included processes such as:
Querying certain fields in the source data to capture supplemental information, and then writing code to split or extract or take extra characters out of the values and assign the information to the appropriate columns.
Processing files that, either because of the way we had to query servers or because of how state departments sent us data, were split up by activity type, in a way that allowed us to capture all of the information so it wouldn’t be lost in downstream processes.
Creating functions that built off of information in the dataset to create new columns — like the net acres column, for example, for which we created an Idaho-specific function that calculated net acreage based on the percentage of state ownership, as indicated in the trust names.
Dataset merge
After all the data had been processed and cleaned, we needed to merge the various state files. The querying process ended up producing multiple files for each state, based on the number of trust names we were filtering for, as well as the rights type. Arizona, for example, had six trusts that sent revenue to the University of Arizona, each containing surface and subsurface acreage. Thus, we had 12 total AZ-specific files, since we generated six files, one for each trust, for surface acres, and another for subsurface acres.
These generated files are uniform to themselves, which means additional adjustments needed to be made for them to merge properly. So, before we merged all of a state’s files, we took each one — separated by rights type and trust name — and deleted the duplicate geometries that existed. We wanted to avoid repeating parcels that contained the same information because of the impact it would have on the acreage summaries, which is why we take a single file and delete information that contains the same rights type and trust name. In the process of geometric deduplication, we have taken particular care to aggregate any information that may be different — which, in our work, was mostly related to activity type. In these cases, if we deduplicated two parcels that were the same except for land use activity type that we noted in the raw data (not identified later in the activity match process), we combined both activities into a list in the activity field.
We can look at how the deduplication process plays out with an example in Montana and how it affects acreage. In our analysis, we report that Montana has 104,585.7 subsurface acres in its state trust land portfolio. However, that number refers to unique subsurface parcels in Montana. This is because we acquired the subsurface data as three separate files, identifying parcels affiliated with coal, oil and gas, or other minerals. Our process found parcels from different files that overlapped. So, we deleted the extra parcels and combined the activities. That way, we could use the main spreadsheet to determine that Montana’s subsurface acreage is broken down like this:
Coal: 2,013.4 acres
Oil and gas: 103,341.09 acres
Other minerals: 1243.51 acres
The sum of Montana’s subsurface acreage, by that analysis, is 106,598.
The difference in numbers is because some subsurface acres have multiple activities occurring on them. Our deduplication process identifies those acres with multiple activities and reduces that number to 104,585.7 acres.
As a note, we initially combined parcels that were geometric duplicates but had different rights types (for example, one had surface and the other had subsurface) to reflect that a parcel had both surface and subsurface rights. However, we found that this led to inaccuracies. In this final dataset, parcels have either surface or subsurface rights (or timber, in the case of Washington). Users should take care to note that instances of seemingly duplicated land parcels reflect this adjustment.
Prior to merging all state files into a single file, we calculated parcel acreage in the original source projection. Though most states record acreage of trust land parcels, several do not. So to assign acreage to parcels that had no area indicated and to create a consistent area measurement, we spatially calculated the acreage of all parcels through GIS to supplement the state-reported acres column. For accuracy, we calculated the acreage of the parcels in their initial source CRS and cross-referenced calculations with state agencies.
Mapping the land use activity
To identify what types of activity currently takes place on these parcels, we collected datasets on different kinds of land use from states, including, but not limited to, active and inactive leases for coal, oil and gas, minerals, agriculture, grazing, commercial use, real estate, water, renewable energies, and easements. We searched state databases or contacted land use offices to acquire spatial data, and we queried data through REST APIs. Initially, we called on state servers each time we ran our activity match operations, but the processing time was too inefficient, so we converted the majority of the datasets to shapefiles for faster processing.
It is important to note that states manage and track land use activity data in a variety of ways. Some states have different datasets for each type of activity, while some combine all land use activity into a single file. Some states indicate whether a certain lease or activity is presently active or not, some specify its precise status (prospecting, drilling, etc.), and some don’t include that information at all. Activities might be broadly classified as easement, agriculture, oil and gas, or coal — however, there might be a more specific description about its nature such as “Natural Gas Storage Operations,” “Access Road,” or “Offset Gas Well Pad.” Some states use numbers that require a key to interpret the activity. To accommodate these variations, we used the activity description that struck the best balance between being detailed and being clear, which either meant calling on the value of a specific column or titling the data layer as something general (“Oil and Gas”) and using that as the activity name. Users can look at the activity_match.py and state_data_sources.py files for further detail.
To identify how state trust land parcels are used, we gathered state datasets with spatial information on where land use activities take place. The data came as either points or polygons.
Users should note that, in the case of South Dakota, very few datasets on state land use activity were publicly accessible. Though we filed public records requests to obtain information, the state did not return our requests, leaving the activity fields for that state mostly empty of content apart from parcel locations. Because there were so many data points in the information coming from states that were being matched against each row in the Grist dataset, we needed to find a way to expedite the process. Ultimately, we organized the activity datasets from each state into their own R-trees, tree data structures that are used to index multidimensional information, which allowed us to group together nearby parcels (which we will use from here on to mean polygons or points). For point data, we established bounding “envelopes” around each point to create the smallest appropriate polygon. In the diagram below, you can see an example of how nearby parcels are grouped together.
Grist
This data structure works by collecting nearby objects and organizing them with their minimum bounding rectangle. Then, one activity-set-turned-R-tree was compared to our trust land dataset at a time. In that process, a comparison looked at one Grist parcel through an activity’s R-tree, which is like a cascading way of identifying what parcels are close together. Whenever a query is conducted to compare another dataset against information in this R-tree, if a parcel does not intersect a given bounding rectangle, then it also cannot intersect any of the contained objects.
In other words, instead of comparing every parcel in our trust land dataset to every single other activity parcel in all of the state datasets, we are able to do much faster comparisons by looking at bigger areas and then narrowing down to more specific parcels when it’s relevant.
When the R-trees were established, we also had a process that looked at the distance from bounding rectangles in a state activity dataset’s tree structure and the closest points in the Grist state trust lands dataset. We only tracked that an activity was present on a trust land parcel if it overlapped and was the same geometric feature. That first method of geographic overlap test was called on Geopandas GeoSeries operations, seeing if a Grist-identified parcel contained, crossed, covered, intersected, touched, or was within an activity parcel. If any of the conditions were true, we “kept” that data, and marked that activity as present on the associated parcel.
We also had a second set of containment criteria that, if met, resulted in that activity being recorded as present. If we pulled in an activity parcel and, in comparing it to our trust land parcel dataset, found that it was the same geographic location, size (in acreage), and shape (via indices), we considered it to be a “duplicate parcel,” and recorded the presence of the relevant activity. We included all activities as a full list in the “activity” field associated with any given parcel.
Additionally, it is important to note that we made three kinds of modifications specific to the various land use activity layers, depending on the available data. First, there were some layers that had a field within the dataset indicating whether or not it was active. For those, we were able to assign an activity match only if that row was reported as active. Second, there were several layers that had relevant details we could use to supplement the activity description, which we included. Lastly, we only included activities relevant to the rights type associated with a parcel. If a parcel had subsurface rights, for example, then we did not indicate activities that may have happened on the surface — say, agriculture or road leases. Similarly, if a parcel had surface rights, we did not include subsurface activity, like minerals or oil and gas. We made additional adjustments to layers that contained “miscellaneous” data, containing activities that were surface or subsurface activities in the same layer. For those layers, we created a list of subsurface activity terms that would appear on surface-rights based parcels. This way, we ensured that the miscellaneous data layers could be read in their entirety, without misattributing activities.
Users can look at the activity_match.py and state_data_sources.py files for further detail.
Lastly, we generalized land use activities in order to create the data visualizations that accompany the story — specifically, the land use activity map. For user readability, we wanted to give an overarching perspective on how much land is used for some of the most prevalent activities. To do this, we manually reviewed all the values in the activity field and created lists that categorized specific activities into subsets of broader categories: fossil fuels, mining, timber, grazing, infrastructure, and renewable energy. With fossil fuels, for example, we included any activities that mentioned oil and gas wells or oil and gas fields, offset well pads, tank batteries, etc. Or, with infrastructure, we included activities that mentioned access roads or highways, pipelines, telecommunications systems, and power lines, among others. Some parcels are associated with multiple land uses, such as grazing cattle and oil production. In these cases, the acreage is counted for each practice. These lists then informed what parcels showed up in the six broad categories we featured in the land use map. (For further detail, users can explore the GitHub repo for our webpage interactives.)
Join to USFS Cession data
For a more comprehensive understanding of the dataset in its historical context, we joined the stl_dataset_extra_activities.geojson file to cession data from the U.S. Forest Service, or USFS. This enabled us to see the treaties or seizures that transferred “ownership” of land from tribal nations to the U.S. government. We have included steps here on how to conduct these processes in Excel and QGIS, which is a free and open access GIS software system. Similar operations exist in programs like ArcGIS. The steps to conduct the join can be found in our README file and in stl_dataset_extra_activities_plus_cessions.csv on GitHub.
Calculate financial information
Based on accounting of historical payments for treaties performed for legal proceedings undertaken by the Indian Claims Commission and the Court of Claims, we identified the price per acre for Royce cession areas underlying the parcels in the dataset. Using the average price per acre for cessions, we calculated the amount paid to Indigenous nations for each parcel.
Some parcels were overlapped by multiple cession areas. In those cases, to calculate the total paid to Indigenous nations for a parcel, we added the amount paid for each individual overlapping cession together.
To adjust for inflation we used CPI-based conversion factors for the U.S. dollars. For more on conversion factors, see here. We derived inflation adjustment factors from the tabular data available here.
For example, if Parcel A had 320 acres and overlaps Cession 1 where the U.S. bought the land for $0.05 per acre, part of Cession 2 that was seized and had no associated payment, and part of Cession 3 where the U.S. bought the land for $0.30 per acre, we calculated:
Price of parcel = (Total acreage x Price described in Cession 1) + (Total acreage x Price described in Cession 2 …) etc.
So:
Parcel A Price = (320*Cession1Price[$0.05]) + (320*Cession1Price[$0]) + (320*Cession1Price[$0.30])
Parcel A Price = $16 + $0 + 96
Price of parcel A = $112.00
A total of $112 is the price the federal government would have paid to tribal nations to acquire the land. In our dataset, the financial information on cessions has already been adjusted for inflation and can be considered as the amount paid in 2023 dollars.
Note that there are some Royce Cession ID numbers that we determined, after further research, were not actually land cessions. Rather, they described reservations created. We excluded these areas from our payment calculation.
We do not yet have financial information for cession ID 717 in Washington. The cession in question is 1,963.92 acres, and its absence means that the figures for price paid per acre or price paid per parcel are not complete for Washington.
It is also important to note that when documenting Indigenous land cessions in the continental United States, the Royce cession areas are extensive but incomplete. Although they are a standard source and are often treated as authoritative, they do not contain any cessions made after 1894 and likely miss or in other ways misrepresent included cessions prior to that time. We have made efforts to correct errors (primarily misdated cessions) when found, but have, in general, relied on the U.S. Forest Service’s digital files of the Royce dataset. A full review, revision, and expansion of the Royce land cession dataset is beyond the scope of this project.
Generate summary statistics
We wanted to aggregate this information so people could analyze the parcel data associated with a specific university or with a specific tribal nation. We generated two summary datasets: First, we combined all of the parcels by university to show their related tribes and cessions and how much the U.S. would have paid for these lands that they then gave to the universities. We created a second equivalent summary analysis that organizes information by present-day tribes and shows the associated universities, cessions, and payments. This step was accomplished after merging land cession and U.S. Forest Service data for better ease interacting with tribal leaders and impacted communities, as well as the removal of historic names, some of which are considered offensive today.
Please note that there were seven instances of tribes with similar names that we manually combined into a single row.
Bridgeport Indian Colony, California, and Bridgeport Paiute Indian Colony of California
Burns Paiute Tribe of the Burns Paiute Indian Colony of Oregon and Burns Paiute Tribe, Oregon
Confederated Tribes and Bands of the Yakama Nation and Confederated Tribes and Bands of the Yakama Nation, Washington
Nez Perce Tribe of Idaho and Nez Perce Tribe, Idaho
Quinault Tribe of the Quinault Reservation, Washington, and Quinault Indian Nation, Washington
Confederated Tribes of the Umatilla Reservation, Oregon, and Confederated Tribes of the Umatilla Indian Reservation, Oregon
Shoshone-Bannock Tribes of the Fort Hall Reservation, Idaho, and Shoshone-Bannock Tribes of the Fort Hall Reservation of Idaho
This user guide is designed for both general users and experienced researchers and coders. No coding skills are necessary to work with this dataset, but a basic working knowledge of tabular data files in Excel is required, and for more experienced users, knowledge of GIS.
Over the past year, Gristhas located all state trust lands distributed through state enabling acts that currently send revenue to higher education institutions that benefited from the Morrill Act. We’ve also identified their original Indigenous inhabitants and caretakers, and researched how much the United States would have paid for each parcel, based on an assessment of the cession history (according to the U.S. Forest Service’s record of the land associated with each parcel). We reconstructed more than 8.2 million acres of state trust parcels taken from 123 tribes, bands, and communities through 121 different land cessions — a legal term for the giving up of territory.
It is important to note that land cession histories are incomplete and accurate only from the viewpoint of U.S. law and historical negotiations, not to Indigenous histories, epistemologies, or historic territories not captured by federal data. The U.S. Forest Service dataset, which is based on the Schedule of Indian Land Cessions compiled by Charles Royce for the Eighteenth Annual Report of the Bureau of American Ethnology to the Secretary of the Smithsonian Institution (1896-1897), covers the period from 1787 to 1894.
This information represents a snapshot of trust land parcels and activity as of November 2023. We encourage exploration of the database and caution that this snapshot is likely very different from state inventories 20, 50, or even 100 years ago. Since, to our knowledge, no other database of this kind — with this specific state trust land data benefitting land-grant universities — exists, we are committed to making it publicly available and as robust as possible.
For additional information, users can read our methodology or go to GitHub to view and download the code used to generate this dataset. The various functions used within the program can also be adapted and repurposed for analyzing other kinds of state trust lands — for example, those that send revenue to penitentiaries and detention centers, which is present in a number of states.
Note: If you use this data for your reporting, please be sure to credit Grist in the story and please send us a link.
This database contains a GeoJSON and CSVs, as well as a multi-tab spreadsheet that aggregates and summarizes key data points.
GeoJSON
National_STLs.geojson
CSVs
National_STLs.csv
Tribal_Summary.csv
University_Summary.csv
Excel
GRIST-LGU2_National-STL-Dataset.xlsx, with protected tabs that include:
– Main Spreadsheet – Tribal Summary – University Summary
The data can be spatially analyzed with the JSON file using GIS software (e.g. ArcGIS or QGIS), or analyzed with the CSVs or Excel main spreadsheet. To conduct analysis without using the spatial file, we recommend using the National_STLs_ALL_Protected.xlsx sheet, which includes tabs for the summary statistics sheets. The CSVs will mostly be useful for importing the files into GIS software or other types of software for analysis.
Tips for using the database
Summary statistics
To understand the landscape of state trust land parcels at a quick glance, users can reference the summary statistics sheets. The Tribal_Summary.csvand the University_Summary.csvshow the total acreage of trust lands associated with each tribe or university, as well as context on what cessions and tribes are affiliated with a particular university or, conversely, what universities and states are associated with individual tribal nations.
For example, using the University_Summary.csv a user can easily generate the following text:
“New Mexico State University financially benefits from almost 186,000 surface acres and 253,500 subsurface acres, taken from the Apache Tribe of Oklahoma, Comanche Nation, Fort Sill Apache Tribe of Oklahoma, Jicarilla Apache Nation, Kiowa Tribe, Mescalero Apache Tribe, Navajo Nation, San Carlos Apache Tribe, Tonto Apache Tribe, and White Mountain Apache Tribe. Our data shows that this acreage came into the United States’ possession through 8 Indigenous land cession events for which the U.S. paid approximately $59,000, though in many cases, nothing was paid. New Mexico engages primarily in oil and gas production, renewables, and agriculture and commercial leases.”
Grist
To do so, simply fill in the sections you need from the tabular data of the university summary tab: [column B] benefits from almost [column D] surface acres and [column C] subsurface acres, taken from [column H] tribe (or [column G] total number of tribes). Our data shows that this acreage came into the United States’ possession through [column K] cessions (column K shows total number of cessions) for which the U.S. paid approximately [column F] though in many cases, nothing was paid. New Mexico engages primarily in [National_STLs.csv, column K].
Using Tribal_Summary.csvusers can also center stories through Indigenous nations. For example: “The Cheyenne and Arapaho Tribes of Oklahoma ceded almost 66,000 surface acres and 82,500 subsurface acres, through 2 land cession events, for the benefit of Colorado State University, Oklahoma State University, and the University of Wyoming. For title to those acres, the United States paid the Cheyene and Arapaho Tribes approximately $6.00.”
Grist
Similarly to the university tab, one can plug in relevant information: [column B] ceded almost [column F] surface acres and [column E] subsurface acres, through [column C] land cession events, for the benefit of [column H].
To get information on how much the United States paid tribes, if anything, filter for the parcels of interest in the ‘Main Spreadsheet’ of the National_STLs.xlsx file and add the price paid per parcel column [column X].
Navigating the data
For users who want to conduct analysis on and understand the landscape of state trust lands without using the spatial file, they can use the protected Excel sheet. (The sheet is protected so that cell values are not accidentally rewritten while users search the information.)
As an example, if users wanted to do research on a specific institution, they can adjust multiple columns at once in the Excel main spreadsheet to quickly isolate the parcels they are specifically interested in.
Say a user wanted to figure out how many acres of state trust lands specifically affiliated with the Navajo Nation are used for grazing in Arizona.
Start by opening the protected National_STLs.xlsx sheet.
In column B, click the drop-down arrow and select so that only Arizona parcels are showing.
Grist
Then, go to column K and use the drop-down menu to select parcels where “grazing” is listed as one of the activities. It’s important to note that many parcels have multiple activities attached to them.
Grist
Then, go through all of the present_day_tribe columns (AA, AE, AI, AM, AQ, AU, AY, BC) and filter for rows that list the Navajo Nation as one of the tribes. It is not always the case that tribes are present in all eight of the columns, and most parcels do not intersect with multiple cession areas.
When filtering through a column for specific entries, like selecting all parcels with any grazing present (even if other activities are there), we recommend users open up the filtering drop-down menu, unselect all entries, and then type the query you’re interested in in the search bar, and select the results that show up.
We find a total of 20,278 acres in Arizona that have grazing activity on Navajo land.
Grist
This kind of approach can be used to filter for any combination of parcels, and we encourage you to explore the data this way.
Visualizing parcels
To visualize this data, users can use the GeoJSON file in a GIS program of their choice. If users are unfamiliar with how to filter for specific parcels through those programs, they can identify the exact parcels they want in Excel and then use that to select parcels in a GIS program.
First, identify the specific parcels of interest using filters (like in the situation described above), and then copy the list of relevant object IDs (in column A) into its own CSV file.
Grist
Then, in the GIS software, import the CSV file and join it to the original National_STLs.geojson file.
Grist
Grist
Grist
Grist
After the file is joined, there will be an additional column to the National_STLs layer, and users can filter out the blank rows (which would be blank because they did not match with parcels of interest in the CSV file) and select the polygons that represent the parcels the user is interested in.
Grist
Grist
In QGIS, you can use the “Zoom to Layer’” button to visualize the resulting query.
Grist
As an alternative to performing the filtering in Excel and executing the self-join as described above, users may also filter the dataset directly in the GIS program of their choice using structured queries. For example, to replicate the query illustrated above, use the following filter expression in QGIS on the main GeoJSON file:
Grist
Calculating acreage
The acreage of trust lands within a state has been determined as consisting of acres with surface rights or subsurface rights. For further background on this process, please see our methodology documentation.
We also included a column for net acreage, since in some places — like North Dakota and Idaho — the state only has partial ownership over some of the parcels. If the field is blank, the state has 100 percent ownership of the parcel. To calculate this, we multiplied the acreage of a parcel by percentage of ownership.
Missing cession payment
We do not yet have financial information for cession ID 717 in Washington. The cession in question is 1,963.92 acres, and its absence means that the figures for price paid per acre or price paid per parcel are not complete for Washington.
It is also important to note that when documenting Indigenous land cessions in the continental United States, the Royce cession areas are extensive but incomplete. Although they are a standard source and are often treated as authoritative, they do not contain any cessions made after 1894 and likely miss or in other ways misrepresent included cessions prior to that time. We have made efforts to correct errors (primarily misdated cessions) when found, but have, in general, relied on the U.S. Forest Service digital files of the Royce dataset. A full review, revision, and expansion of the Royce land cession dataset is beyond the scope of this project.
Missing Oklahoma lands
It’s important to note that we could not find information for 871 surface acres and 5,982 subsubsurface acres in Oklahoma, because they have yet to be mapped, digitally, or because of how they are sectioned on the land grid. We understand that this acreage does exist based on lists of activities kept by the state. However, those lists do not provide mappable data to fill these gaps. In order to complete reporting on Oklahoma, researchers will need to read and digitize physical maps and plats held by the state — labor this team has been unable to provide.
Additional WGS84 files in data generation
In addition to the GeoJSON files output at each step, our workflow produces a version of each GeoJSON file using the World Geodetic System 84 (WGS84) datum and a spherical geographic coordinate system (EPSG:4326). This is the standard coordinate reference system (CRS) for all GeoJSON files according to the specification; prior versions of the specification supported alternate CRSs, but have since been deprecated. In the source code, we rely on GeoPandas’.to_crs method to perform the transformation to EPSG:4326.
WGS84 versions of GeoJSON files are necessary when mapping datasets using popular web-mapping libraries like Leaflet, Mapbox, MapLibre, and D3. These libraries all expect data to be encoded using EPSG:4326; they expose various projection APIs to reproject data on-the-fly in a browser. You should use the _wgs84 versions of the pipeline’s GeoJSON files if you’re trying to visualize the datasets using one of these libraries. For QGIS users, ensure your project CRS is set to EPSG:4326 before uploading these GeoJSON files.
Using the code
Users will be able to explore the codebase on the GitHub repository, which will be made public upon the lifting of Grist’s embargo. Further details on how to run each step and an explanation of all required files are available in the README.md document.
Creative Commons license
This data is shared under a Creative Commons BY-NC 4.0 license (“Attribution-NonCommercial 4.0 International”). The CC BY-NC license means you are free to copy and redistribute the material in any medium or format; and remix, transform, and build upon the material. Grist cannot revoke these freedoms as long as you follow the license terms. These terms include giving appropriate credit, providing a link to the license, and indicating if changes were made. You may do so in any reasonable manner. Furthermore, you may not use the material for commercial purposes, and you may not apply legal terms or technological measures that legally restrict others from doing anything the license permits.
If you republish this data or draw on it as a source for publication, cite as: Parazo Rose, Maria, et al. “Enabling Act Indigenous Land Parcels Database,” Grist.org, February 2024.
File Descriptions
National_STLs.geojson
The schema for this document is the same as the National_STLs.csvand National_STLs_Protected.xlsxfiles.
This spreadsheet contains 41,792 parcels of state trust lands that benefit 14 universities. Each row describes the location of a unique parcel, along with information about the entities currently managing the land, what rights type and extractive activities are associated with the parcel, which university benefits from the revenues, and its historic acquisition by the United States, as well as the original Indigenous caretakers and the current tribal nations in the area.
An important note about rights type: Washington categorizes timber rights as distinct from surface rights, and we present the data here accordingly. Note that other states do not adhere to this distinction, and thus timber parcels in other states are considered surface parcels. If you would like to generate national summaries of surface rights in a more colloquial sense, consider adding Washington’s timber parcels to your surface calculations.
The file contains the following columns:
object_id
A unique, Grist-assigned identifier for the specific state trust land parcel
state
State where parcel is located
state_enabling_act
Name of the enabling act that granted new territories statehood, along with stipulations of bestowing Indigenous land as a part of the state trust land policy
trust_name
Beneficiaries of state trust land revenue can be identified within state government structure by the trust name; we used the trust name to identify the funds that were specifically assigned to the universities we focused on
managing_agency
Name of the state agency that manages the state trust land parcels
university
Land-grant university that receives the revenue from the associated state trust land parcel
acres
Reported acreage of the state trust land parcel from the original data source by the state
gis_acres
Acreage calculated by analyzing the parcels in QGIS
net_acres
The net acreage of a parcel, determined by the percentage of state ownership related to that parcel specifically.
rights_type
Indicates whether the state/beneficiary manages the surface or subsurface rights of the land within the parcel, or both
reported_county
County where parcel is located, as reported by the original data source
census_bureau_county_name
County where parcel is located, based on a comparative analysis against Census Bureau data
meridian
A line, similar to latitude and longitude lines, that runs through an initial point, which together with the baseline form the highest level framework for all rectangular surveys in a given area. It is also the reference or beginning point for measuring east or west ranges.
township
36 sections arranged in a 6-by-6 square, measuring 6 miles by 6 miles. Sections are numbered beginning with the northeasternmost section (#1), proceeding west to 6, then south along the west edge of the township and to the east (#36 is in the SE corner)
range
A measure of the distance east or west from a referenced principal meridian, in units of 6 miles, that is assigned to a township by measuring east or west of a principal meridian
section
The basic unit of the system, a square piece of land 1 mile by 1 mile containing 640 acres
aliquot
Indicates the aliquot part, e.g. NW for northwest corner or E½SW for east half of southwest corner, or the lot number.
block
A parcel of land within a platted subdivision bounded on all sides by streets or avenues, other physical boundaries such as a body of water, or the exterior boundary of a platted subdivision.
data_source
Data on state parcels was acquired either from a records request to state agencies or from requests to a state server; if a state server was used, the website is recorded here
parcel_count
In our merge process, we combined some parcels, particularly in Minnesota, and this column captures how many parcels were aggregated together, to maintain accurate parcel count and acreage
agg_acres_agg
The sum of acres across all parcels contained in a given row. For most states, this field will equal that of the acres field. For Minnesota, some small parcels were combined during the spatial deduplication process, and this field reflects the sum of the corresponding acres field for each parcel. (See methodology for more information.)
all_cession_numbers
Refers to all the land cessions (areas where the federal government took the Indigenous land that later supplied state land) that overlap with this given parcel
price_paid_for_parcel
The total price paid by the U.S. government to tribal nations
cession_num_01-08
A single cession that overlaps a given parcel
price_paid_per_acre
The price the U.S. paid (or didn’t pay) per acre, according to the specific cession history
C1[-C8]_present_day_tribe
As listed by the U.S. Forest Service, the present day tribe(s) associated with the parcel
C1[-C8]_tribe_named_in_land_cessions_1784-1894
As listed by the U.S. Forest Service, the tribal nation(s) named in the land cession associated with the parcel
Tribal_Summary.csv
This spreadsheet shows summary statistics for all state trust land data we gathered, organized by the present-day tribes listed by the U.S. Forest Service.
present_day_tribe
As listed by the U.S. Forest Service, the present day tribe(s)
cession_count
Total number of cessions associated with a present-day tribe
cession_number
List of cessions associated with a present-day tribe
subsurface_acres
Total number of subsurface acres associated with a present-day tribe
surface_acres
Total number of surface acres associated with a present-day tribe
timber_acres
Total number of timber acres associated with a present-day tribe (only relevant in Washington state)
unknown_acres
Total number of acres with an unknown rights type (only relevant for two parcels in South Dakota)
university
Universities that receive revenue from the parcels associated with a present-day tribe
state
States where the parcels associated with a present-day tribe are located
Total number of acres with an unknown rights type (only relevant for two parcels in South Dakota)
university
Universities that receive revenue from the parcels associated with a present-day tribe
state
States where the parcels associated with a present-day tribe are located
University_Summary.csv
This spreadsheet shows summary statistics for all state trust land data we gathered, organized by land-grant university.
university
Land-grant institution that receives revenue from specific state trust land parcels
subsurface_acres
Total number of subsurface acres associated with a present-day tribe
surface_acres
Total number of surface acres associated with a present day tribe
timber_acres
Total number of timber acres associated with a present day tribe (only relevant in Washington state)
unknown_acres
Total number of acres with an unknown rights type (only relevant for two parcels in South Dakota state)
price_paid
Sum of the price that the U.S. federal government paid to tribes for all the parcels associated with a particular university (the sum of the price paid per parcel column)
present_day_tribe_count
Total number of present-day tribes associated with a land-grant university
present_day_tribe
List of present-day tribes associated with a land-grant university
tribes_named_in_cession_count
Total number of present-day tribes associated with a land-grant university
tribes_named_in_cession
List of present-day tribes associated with a university
cession_count
Total number of cessions associated with a land-grant university
all_cessions
List of cessions associated with a land-grant university
A ‘right to disconnect’ allowing workers to ignore unreasonable contact from their employers outside working hours will be included in the latest tranche of industrial relations reforms following months of negotiation between the Greens and the federal government. On Wednesday, Greens Senator Barabara Pocock and Greens Leader Adam Bandt confirmed that a deal had been…
The free self-exclusion scheme by GamStop controls excessive gambling urges by banning users of online casinos on GamStop for some time. Developed by UKGC and NOSES, the scheme has a period of six months, one year, or five years of self-restriction and can be initiated as soon as all the information of the user has been provided successfully. Over the years, GamStop has provided support to the ones suffering the consequences of excessive gambling and given them relief from the financial burdens of unchecked gambling.
The service legitimises gambling operators and online casinos that work with its UKGC licensing and the mark of sites safe for gambling. Having GamStop service popularises the casinos since the legalisation makes the casinos more trustworthy. The operators would be better protected from scammers and money laundering with GamStop while being well-reputed and recommended by the Gambling Commission.
Effects of being on GamStop for online casinos
It has been made mandatory for online casinos to have GamStop to curb users from unchecked gambling and the casinos can only be called legal if they have the permit. However, it is extremely easy to find casino games not on GameStop – for example, like the one in this article by Rob Davies and Will Terry, in which they analyse online casinos operating without self-exclusion software. Most of such casinos are located outside the UK and do not need a GamStop permit and allow players to bet freely, resulting in more profit overall. At the same time, casinos registered with GamStop enjoy many benefits that make them preferable over offshore or non-GamStop casinos.
Protection from scammers
Money laundering has been on the rise in recent years with the rise of online gambling. In these cases, players and gambling operators risk being deceived. For gambling operators, there is a high chance of being scammed through impostor accounts. Due to the lack of verification of accounts and the deposits being made, the false accounts can easily log into the site and drain out the money being deposited. These accounts can even bet no money and still win huge amounts with fake profiles. GamStop does not let that happen. It asks for detailed information about the player and verifies the player’s identity by running through the details. It also makes sure that the money being deposited comes from a legitimate source and allows players to gamble only after the completion of the process. In this way, money laundering is successfully battled.
Reputational gains
Self-exclusion is highly recommended by the UKGC and in this regard, the influence of GamStop is difficult to underestimate. It is currently relied on the most out of all UK-based betting blockers. A non-GamStop casino would neither be UKGC licensed nor recommended by experts and casino reviewers despite the casino having attractive offers and better bonuses. A licensed casino with titles by famous providers of casino games would both be legal and reviewed and advocated by professional punters due to its better security against money laundering and protection of personal information. Better advertisement is created for GamStop casinos that make up for the accumulation of a lesser profit compared to non-licensed casinos. A superior reputation along with the GamStop logo at the upper corner of every GamStop casino accounts for the popularity of online casinos in the UK.
Compliance with UK legislation
In March 2020, the UKGC made it compulsory for all legalised online casinos to be a part of GamStop’s service and show full cooperation with the scheme. This act was passed to protect the interest of UK players and failing to conform to the rules, the casinos would be closed down with the sites being made inaccessible. The UK legislation may allow gambling but there are plenty of restrictions that surround the gambling scene in Britain. The United Kingdom Gambling Commission thus prefers to keep online gambling under control through rigorous laws. Although GamStop casinos are kept under great restrictions like the unavailability of certain e-games, they get better protection, more fame, and additional sponsorships and partnerships. The casinos also act as welfare systems to create a better gambling environment for players where they feel safe.
Online casinos and GamStop, in a nutshell
Players who choose to seek the path of betterment and battle gambling addiction but without losing the chance to gamble permanently should select GamStop casinos as their go-to option. This free scheme not only attracts positive attention from multiple organisations but also looks towards public well-being. This is a voluntary scheme that when chosen comes into effect instantaneously. In a way, GamStop helps to break the unhealthy cycle of continuous gambling without completely blocking the player’s interests.
Keep in mind that gambling should not be your only option when it comes to entertainment, so feel free to choose something that does not fall under the category of gambling. If, however, you feel like you have a hard time doing so, then online casinos on GamStop should not be the only solution to escape gambling and you might need to seek professional help if your habit gets out of hand. For operators, one should be careful not to surpass the laws set for the casino despite the fame and protection they get from GamStop, the license can be terminated as easily once the casinos allow free gambling, going against the UKGC.
There are 88,000 chronically ill and disabled people ‘missing’ from the tech workforce, according to the professional body for IT.
Disabled people in tech: why is the industry not recruiting them?
Disabled people comprise 16% of the UK workforce but only account for 11% of the technology specialists, according to analysis by the Chartered Institute for IT (BCS), in its Diversity Report 2023: Disability. That means for representation in IT to be equal to workplace norms there should be an additional 88,000 disabled IT specialists employed in the UK.
BCS recently published an additional report called The Experience of Neurodiverse and Disabled People in IT. It reviewed the latest government data and also sought feedback from over 50 IT experts, all of whom had additional needs, about their views on the tech sector.
The gap persists despite an increase in the number of people working in the tech sector reporting disabilities – rising from 196,000 people in 2021 to 208,000 in 2022.
Neurodiversity representation also an issue
Matthew Bellringer, Chair of the BCS Neurodiversity Specialist Group, said:
It’s clear that the IT profession itself can and should be an excellent place for disabled and neurodivergent people to work, and digital tools can be a great enabler.
We have a severe skills gap in tech, which is a massive societal cost. Helping disabled people to utilise their expertise by providing the support they need is essential to boosting the talent pipeline in tech and other sectors.
Some progress has been made. However, it’s disappointing — though not terribly surprising — that many barriers still exist.
Cyber security expert Lisa Ventura MBE, who campaigns for diversity in the tech sector, said:
More needs to be done to promote the positive side of employing people with disabilities and those who are neurodivergent – such as championing their resilience, and ability to look at issues and solve problems from a different perspective.
It’s also essential to ensure accessible products and initiatives are evaluated as fit for purpose and not just imposed regardless – one size does not fill all of us.
Introducing more inclusive practices can benefit all workers. Everyone’s physical, sensory and cognitive abilities vary, and improving matters for people with more significant requirements can help all who share that need to any extent.o
Some neurodivergent people contributing to The Experience of Neurodiverse and Disabled People in IT report appealed for better understanding. One described their anxiety in the workplace:
I feel like an alien trying to hide my neurodiversity.
Another said:
Not making eye contact seems to be seen as submissiveness, not just simply that I don’t want to.
So much more needed for disabled people in tech
Some hearing impaired and Deaf people spoke about the practical issues they encountered, such as enduring vastly different audio levels in online meetings. One respondent said:
I miss much of what some people say. Being unable to keep up with the rate of speech and sometimes complete inaudibility in meeting rooms due to noisy air-conditioning means I can’t turn up my hearing aid volume.
Recommendations from the BCS report include:
Greater education and awareness of disability in the workplace.
Ensuring clear communication in meetings that encompasses all needs.
Appropriate workplace adjustments.
An inclusive recruitment process.
Suitable assistive technology that works for the individual.
A supportive work environment where disabled employees have a voice, are listened to and have their views respected.
Better training for managers and coworkers to understand and rectify the barriers to work faced by disabled people.
Fostering a culture that discourages discriminatory behaviours.
Pro-active initiatives – for instance, consciously deploying neurodiverse individuals in teams.
If you’ve heard anything about the relationship between Big Tech and climate change, it’s probably that the data centers that power our online lives use a mind-boggling amount of power. And some of the newest energy hogs on the block are artificial intelligence tools like ChatGPT. Some researchers suggest that ChatGPT alone might use as much power as 33,000 U.S. households in a typical day, a number that could balloon as the technology becomes more widespread.
The staggering emissions add to a general tenor of panic driven by headlines about AI stealing jobs, helping students cheat, or, who knows, taking over. Already, some 100 million people use OpenAI’s most famous chatbot on a weekly basis, and even those who don’t use it likely encounter AI-generated content often. But a recent study points to an unexpected upside of that wide reach: Tools like ChatGPT could teach people about climate change, and possibly shift deniers closer to accepting the overwhelming scientific consensus that global warming is happening and caused by humans.
In a study recently published in the journal Scientific Reports, researchers at the University of Wisconsin-Madison asked people to strike up a climate conversation with GPT-3, a large language model released by OpenAI in 2020. (ChatGPT runs on GPT-3.5 and 4, updated versions of GPT-3). Large language models are trained on vast quantities of data, allowing them to identify patterns to generate text based on what they’ve seen, conversing somewhat like a human would. The study is one of the first to analyze GPT-3’s conversations about social issues like climate change and Black Lives Matter. It analyzed the bot’s interactions with more than 3,000 people, mostly in the United States, from across the political spectrum. Roughly a quarter of them came into the study with doubts about established climate science, and they tended to come away from their chatbot conversations a little more supportive of the scientific consensus.
That doesn’t mean they enjoyed the experience, though. They reported feeling disappointed after chatting with GPT-3 about the topic, rating the bot’s likability about half a point or lower on a 5-point scale. That creates a dilemma for the people designing these systems, said Kaiping Chen, an author of the study and a professor of computation communication at the University of Wisconsin-Madison. As large language models continue to develop, the study says, they could begin to respond to people in a way that matches users’ opinions — regardless of the facts.
“You want to make your user happy, otherwise they’re going to use other chatbots. They’re not going to get onto your platform, right?” Chen said. “But if you make them happy, maybe they’re not going to learn much from the conversation.”
Prioritizing user experience over factual information could lead ChatGPT and similar tools to become vehicles for bad information, like many of the platforms that shaped the internet and social media before it. Facebook, YouTube, and Twitter, now known as X, are awash in lies and conspiracy theories about climate change. Last year, for instance, posts with the hashtag #climatescam have gotten more likes and retweets on X than ones with #climatecrisis or #climateemergency.
“We already have such a huge problem with dis- and misinformation,” said Lauren Cagle, a professor of rhetoric and digital studies at the University of Kentucky. Large language models like ChatGPT “are teetering on the edge of exploding that problem even more.”
The University of Wisconsin-Madison researchers found that the kind of information GPT-3 delivered depends on who it was talking to. For conservatives and people with less education, it tended to use words associated with negative emotions and talk about the destructive outcomes of global warming, from drought to rising seas. For those who supported the scientific consensus, it was more likely to talk about the things you can do to reduce your carbon footprint, like eating less meat or walking and biking when you can.
What GPT-3 told them about climate change was surprisingly accurate, according to the study: Only 2 percent of its responses went against the commonly understood facts about climate change. These AI tools reflect what they’ve been fed and are liable to slip up sometimes. Last April, an analysis from the Center for Countering Digital Hate, a U.K. nonprofit, found that Google’s chatbot, Bard, told one user, without additional context: “There is nothing we can do to stop climate change, so there is no point in worrying about it.”
It’s not difficult to use ChatGPT to generate misinformation, though OpenAI does have a policy against using the platform to intentionally mislead others. It took some prodding, but I managed to get GPT-4, the latest public version, to write a paragraph laying out the case for coal as the fuel of the future, even though it initially tried to steer me away from the idea. The resulting paragraph mirrors fossil fuel propaganda, touting “clean coal,” a misnomer used to market coal as environmentally friendly.
There’s another problem with large language models like ChatGPT: They’re prone to “hallucinations,” or making up information. Even simple questions can turn up bizarre answers that fail a basic logic test. I recently asked ChatGPT-4, for instance, how many toes a possum has (don’t ask why). It responded, “A possum typically has a total of 50 toes, with each foot having 5 toes.” It only corrected course after I questioned whether a possum had 10 limbs. “My previous response about possum toes was incorrect,” the chatbot said, updating the count to the correct answer, 20 toes.
Despite these flaws, there are potential upsides to using chatbots to help people learn about climate change. In a normal, human-to-human conversation, lots of social dynamics are at play, especially between groups of people with radically different worldviews. If an environmental advocate tries to challenge a coal miner’s views about global warming, for example, it might make the miner defensive, leading them to dig in their heels. A chatbot conversation presents more neutral territory.
“For many people, it probably means that they don’t perceive the interlocutor, or the AI chatbot, as having identity characteristics that are opposed to their own, and so they don’t have to defend themselves,” Cagle said. That’s one explanation for why climate deniers might have softened their stance slightly after chatting with GPT-3.
There’s now at least one chatbot aimed specifically at providing quality information about climate change. Last month, a group of startups launched “ClimateGPT,” an open-source large language model that’s trained on climate-related studies about science, economics, and other social sciences. One of the goals of the ClimateGPT project was to generate high quality answers without sucking up an enormous amount of electricity. It uses 12 times less computing energy than ChatGPT, according to Christian Dugast, a natural language scientist at AppTek, a Virginia-based artificial intelligence company that helped fine-tune the new bot.
ClimateGPT isn’t quite ready for the general public “until proper safeguards are tested,” according to its website. Despite the problems Dugast is working on addressing — the “hallucinations” and factual failures common among these chatbots — he thinks it could be useful for people hoping to learn more about some aspect of the changing climate.
“The more I think about this type of system,” Dugast said, “the more I am convinced that when you’re dealing with complex questions, it’s a good way to get informed, to get a good start.”
The scandal around Fitbit Charge 5 effectively flatlining on users is growing – as the device’s parent company denies it’s anything to do with a rogue software update. However, missing in the story is the fact that many chronically ill people rely on Fitbits to monitor particular conditions. For these people, the death of their devices is having a damaging impact.
Fitbit Charge 5: is it or is it not the software update?
As BBC News reported, Fitbit has been having a few issues. Since late December, countless users have seen their devices die after installing the brand’s latest firmware update. As BBC News reported:
Users on Fitbit’s own forums however are adamant the software change is to blame, with some Charge 5 users urging against installing the update, and describing how their devices no longer work properly, if at all.
“Basically, it’s useless now, the battery’s dead,” Dean, in Essex… told the BBC, as he explained his problems with his Charge 5.
He said previously his device was “working really well” and was “easily” able to last seven days per charge – and said the thought the software update was to blame.
“I don’t really see why hundreds of other people would be having the same problem after installing the update if it wasn’t”.
However, for many people Fitbit is more than just a lifestyle device. It is an essential part of healthcare if you happen to be chronically ill.
A (previously) useful device for chronically ill people
On Twitter (now X), people have been sharing their uses of Fitbit for their chronic illnesses:
Honestly, late 2020 getting a Fitbit was motivated by getting a more accurate step count than from a phone and logging swimming and cycling sessions. Unexpectedly it's been very helpful for monitoring POTS symptoms and advance warning when SIH symptoms are about to get worse.
So my new #Fitbit reminds me daily about my #POTS, courtesy of #MyalgicEncephalomyelitis. Also highlights my scant REM/deep sleep. No wonder I'm so exhausted, just standing up or bending over doing even minimal chores puts me into cardio exercise range bpm. #chronicillness
POTS is where a person’s heartrate does not properly regulate on a change of position – that is, from laying down to sitting, or sitting to standing. It elevates but doesn’t come back down again. As one person on Twitter pointed out:
So, Nicola is tachycardic (having a heartrate of over 100bpm) a lot of the time – by simply standing up. In her, POTS also causes cyclic vomiting syndrome where she vomits uncontrollably – roughly every 30 minutes – for around 24 hours at a time.
Therefore, being able to monitor her heartrate is crucial.
Fitbit Charge 5: losing all its spoons
However, Nicola’s Fitbit also failed in late December – and hasn’t been working ever since. She and the Chronic Collaboration said:
Many of us who live with invisible and chronic illnesses were very keen to try out Fitbit devices. They have allowed patients to constantly monitor heart rates, sleep patterns, and levels of exertion, which for people with chronic conditions like POTS, myalgic encephalomyelitis (ME), and other invisible illnesses, has been revolutionary.
However, the failure of Fitbit Charge 5s has left many of its users not only frustrated but also feeling completely let down and out of pocket. We especially feel let down here at the Chronic Collaboration. While we expect to lose our spoons, we do not expect the device we use to suddenly lose all its spoons too.
So far, Google has denied the failure of the Fitbit Charge 5 is to do with the firmware update. A spokesperson told the BBC:
We’re still investigating this issue, but can confirm it is not due to the recent firmware update. Users should continue to update their devices to the latest firmware and contact Fitbit Customer service at help.fitbit.com if they encounter any issues.
A preposterous response if ever there was one – as you cannot update a dead Fitbit Charge 5. Nicola said that:
This is completely unacceptable and not good enough, Google. You device has gone from Fitbit to Fib-bit.
While the puns are welcome, it is a serious issue.
Fitbit… and similar wearables… aren’t intended for medical diagnosis, a distinction that gadget makers are very clear about. Yet smartwatches and fitness bands can now track metrics, such as blood oxygen saturation and body fat estimates, that may have previously required a visit to the doctor or a specialized device.
Heartrate is one such metric that is crucial for some chronically ill people. So, regardless of what type of device Fitbit Charge 5 considers itself to be, it should as a minimum acknowledge that there is a whole community of people reliant on it every day.
Within this is the bigger question of why chronically ill people living in the UK with conditions like POTS have to spend their own money to monitor their conditions – when the country allegedly has a publicly-funded health service that is supposed to provide this sort of care for free. Answers on a postcode marked ‘government reorganisation and privatisation’.
Fortunately for Nicola, she is on a pharmacist’s counters-worth of medication for her POTS, and it is now relatively under control. For others, they’re not so lucky – and a Fitbit could mean the difference between being unwell and being severely unwell.
Ultimately, though – Google’s half-baked fob-off is not good enough. Chronically ill people like Nicola are reliant on their Fitbits. It needs to recognise this, and take the failure of people’s devices as seriously as they take wearing them.
Findings suggest Jordan is relying on cyberweapon to quash dissent and its use is ‘staggeringly widespread’
About three dozen journalists, lawyers and human rights workers in Jordan have been targeted by authorities using powerful spyware made by Israel’s NSO Group amid a broad crackdown on press freedoms and political participation, according to a report by the lobbying group Access Now.
The information suggests the Jordanian government has used the Israeli cyberweapon against members of civil society, including at least one American citizen living in Jordan, between 2019 and September 2023.


 (@agneponx)


 Featured image via
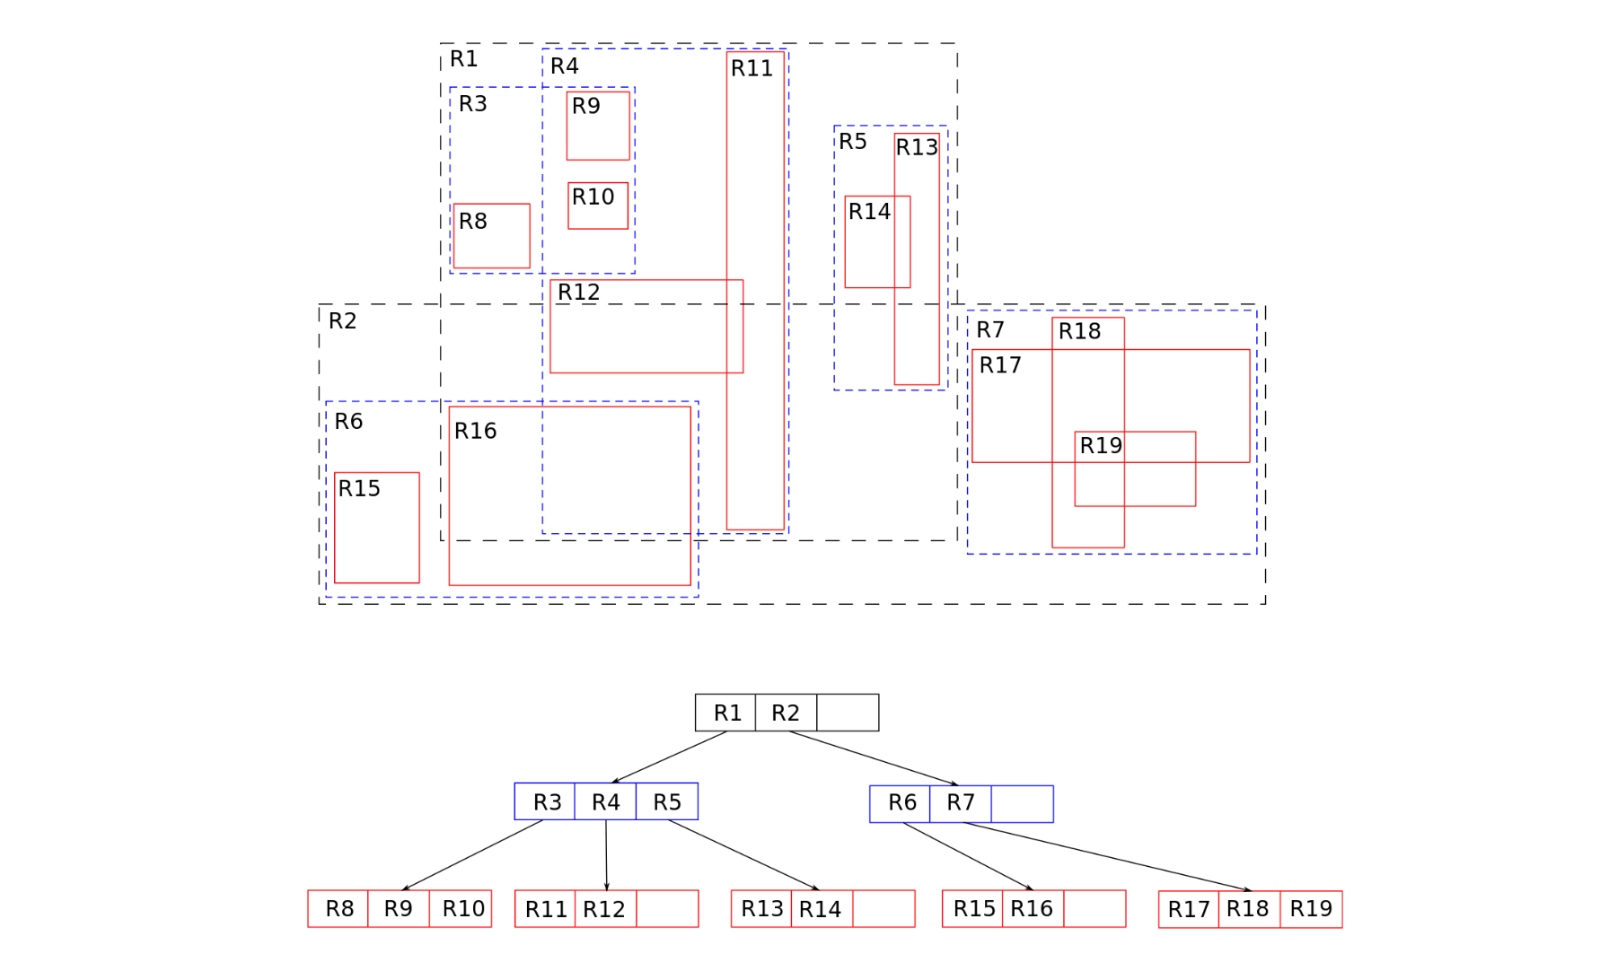


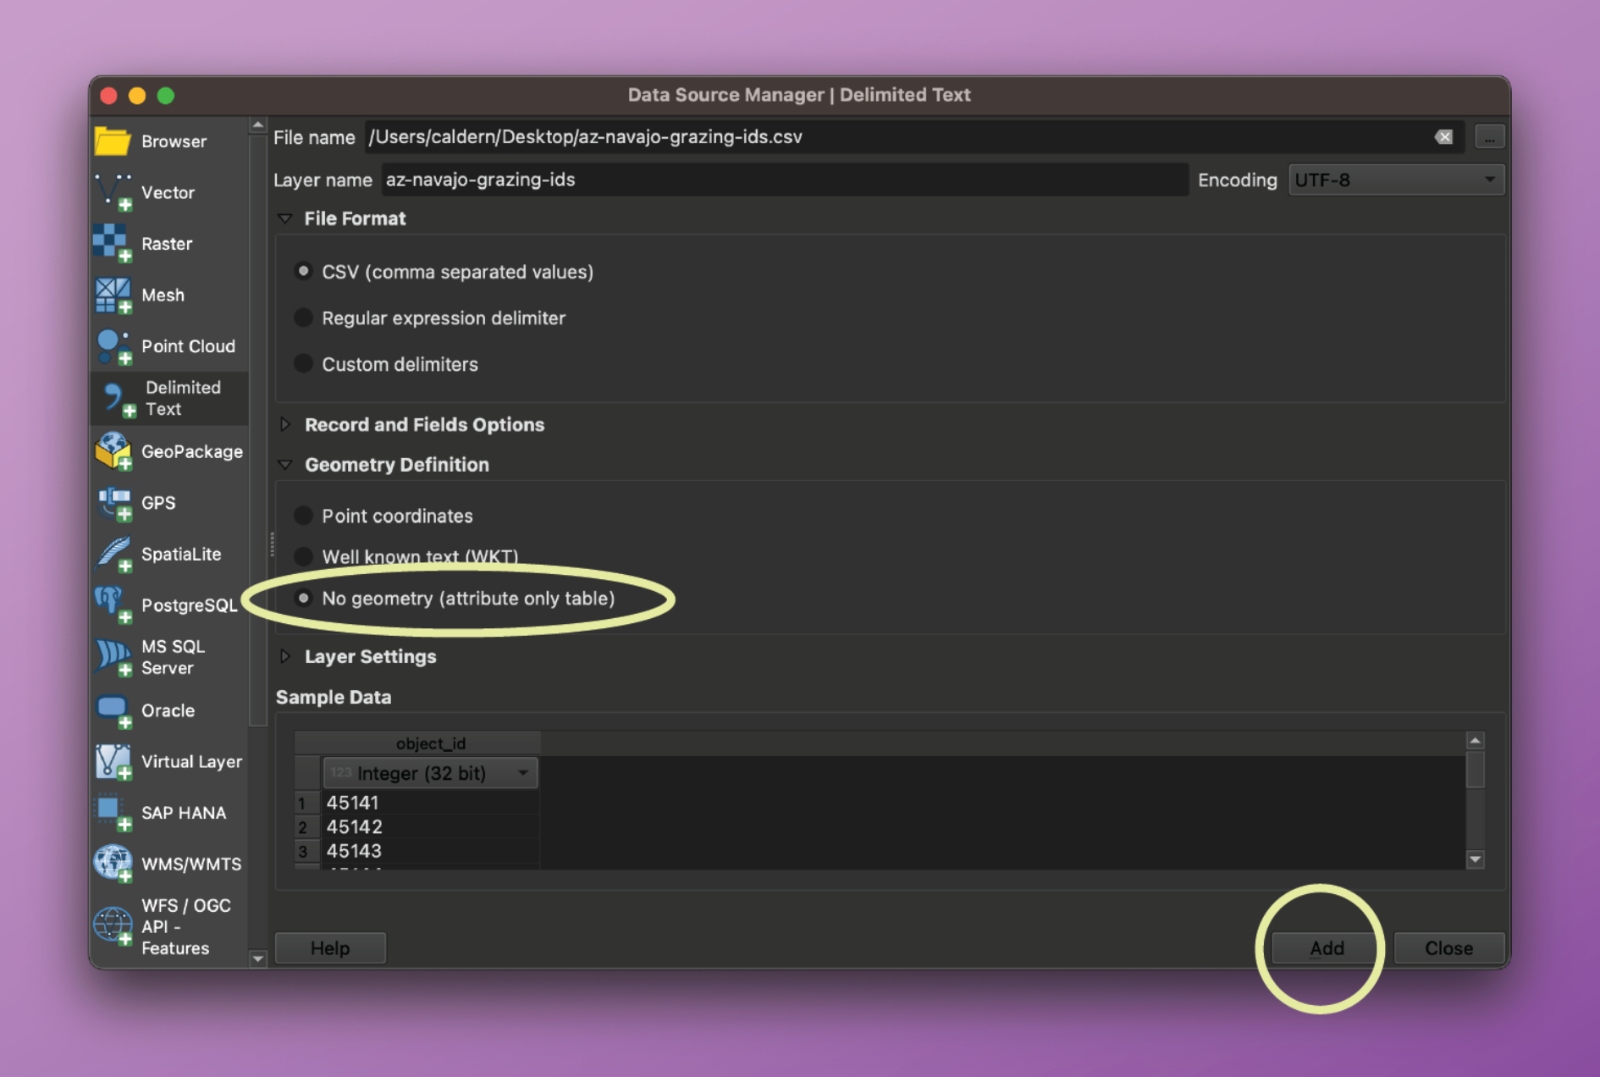

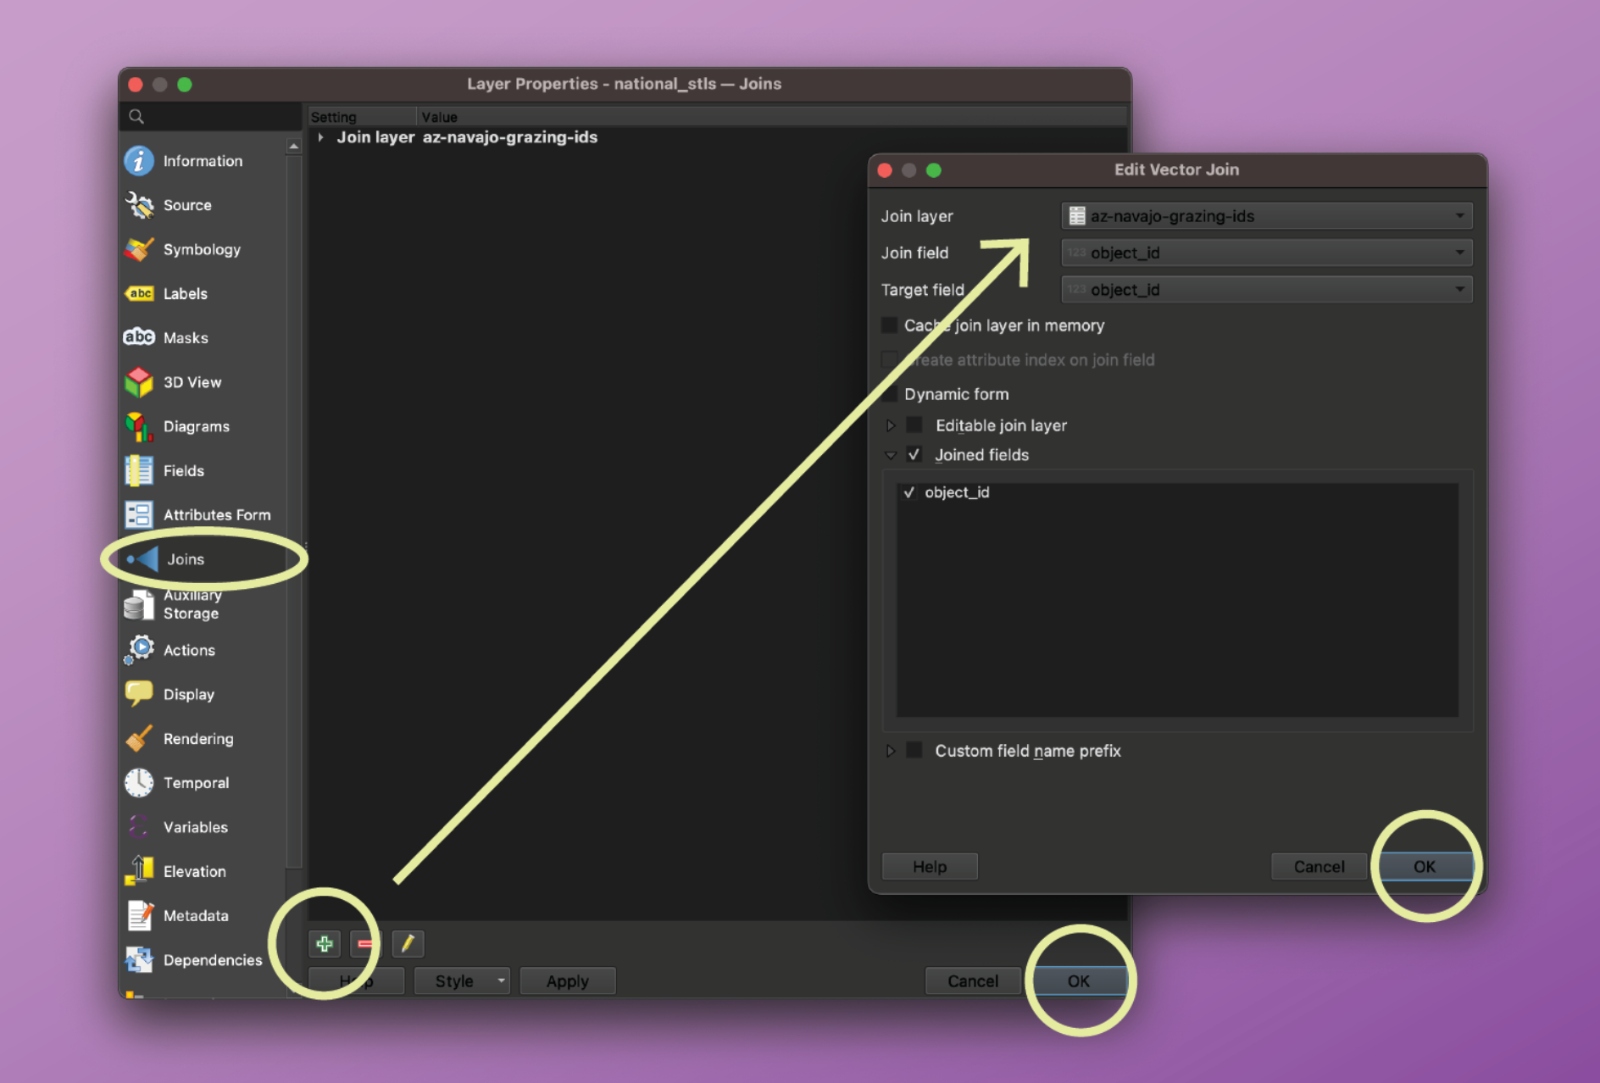

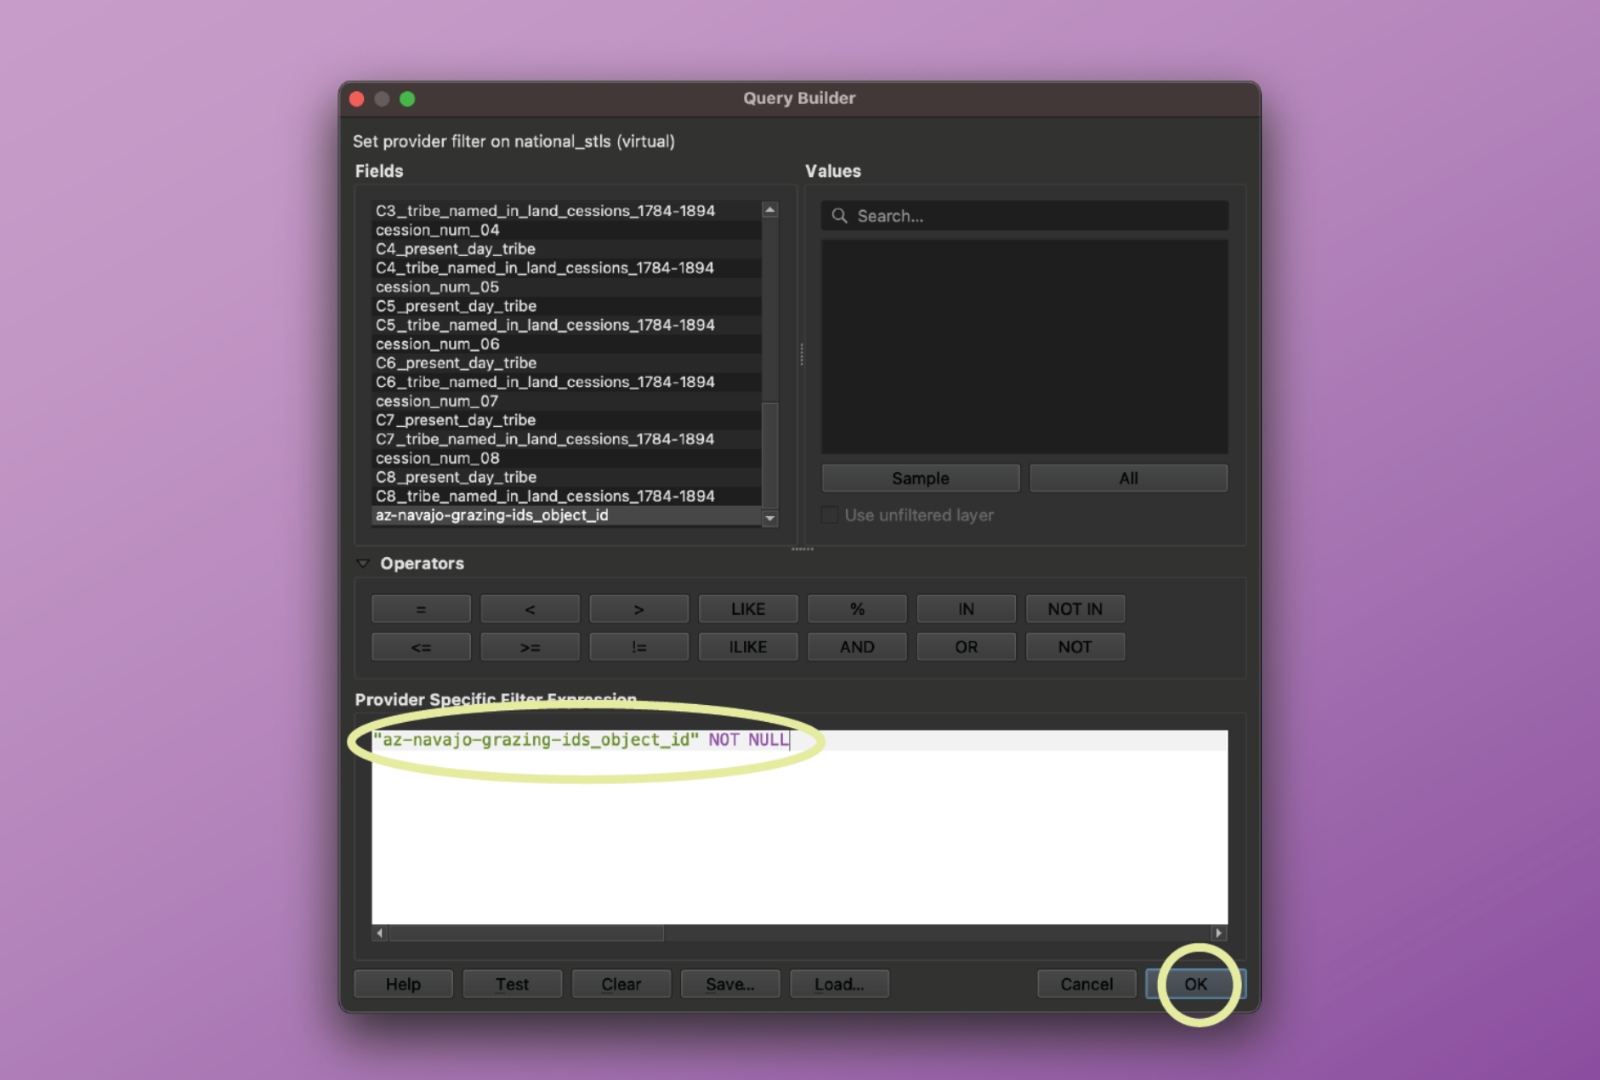
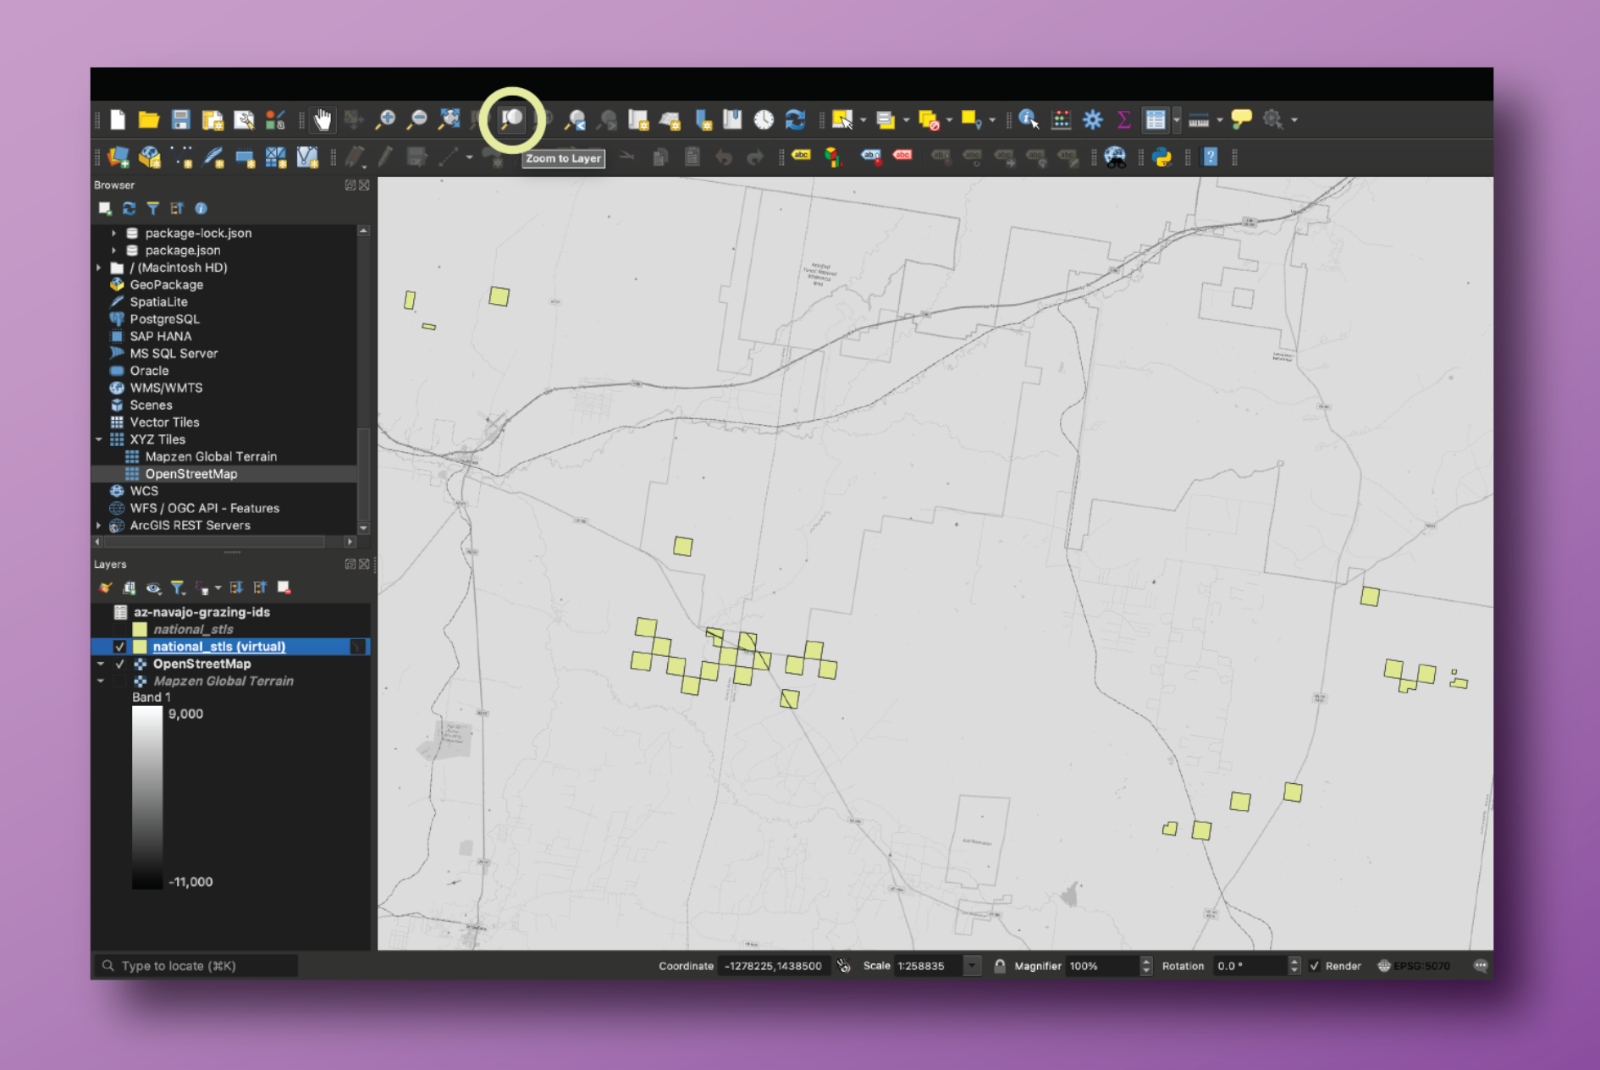
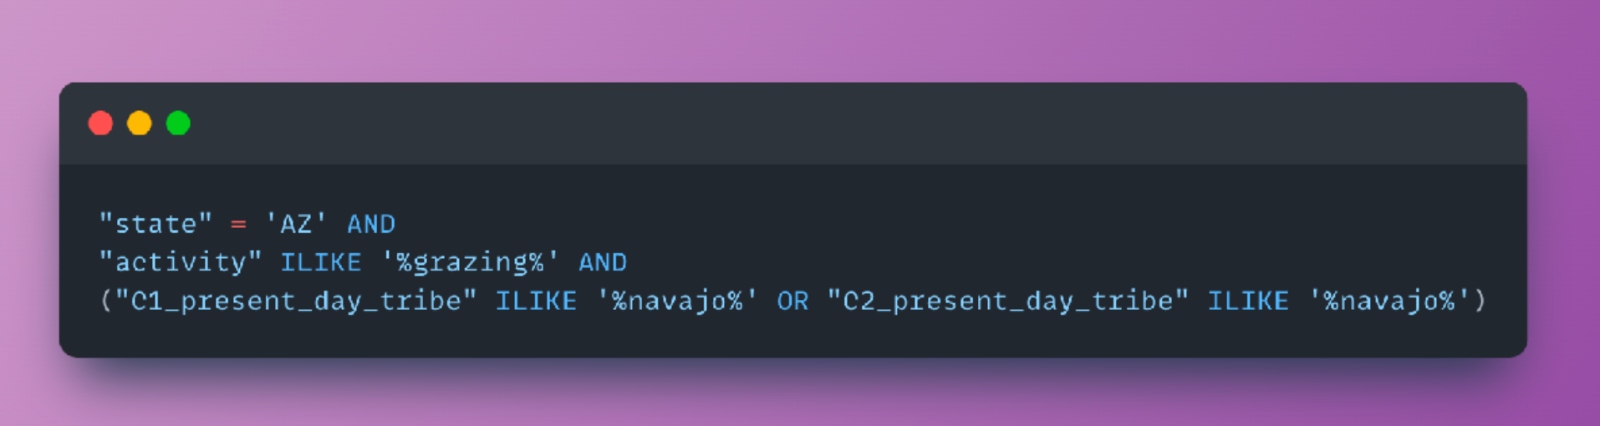


 (@m3rike)
